The Noble Institution Blog

In the Noble Institution Blog, you'll find the latest news about the community, tutorials, helpful resources, and much more! React to the news with the emotion stickers and have fun!

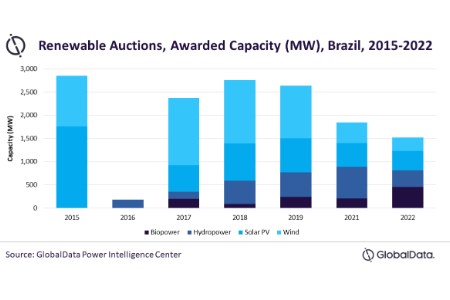
GlobalData: Auctions Crucial for Brazil Renewable Power Expansion


Renewable power market has developed rapidly in Brazil in recent years, thanks to its remarkable progress in wind, biopower, and solar power sectors. The development of renewables has primarily been due to the introduction of the government’s auctioning system against the backdrop of increase in total electricity demand in the country, said GlobalData.

GlobalData: Auctions crucial for Brazil renewable power expansion

As of 2022, wind power capacity has increased to 23.71 GW, biopower capacity to 16.91 GW, and solar photovoltaic (PV) capacity to 23.24 GW, reflecting the success of Brazil’s renewable power market.

GlobalData’s latest report, ‘Brazil Power Market Size, Trends, Regulations, Competitive Landscape, and Forecast, 2023 – 2035’, observes that during 2003 – 2004, the power sector underwent major reforms to step up regulation in the industry through transparency and stability of rules.

Attaurrahman Ojindaram Saibasan, Power Analyst at GlobalData, commented: “Easy access and a fair return on investment for power producers were considered key objectives. A decree was passed during this time allowing the government to establish an auction mechanism and use it as the main method of developing renewable power capacity. Auctions were introduced to bridge the supply demand gap by attracting new generation capacity, ensuring supply adequacy, and procuring electricity based on load forecasts. Auctions are either technology-specific or are technology-neutral.”

Between 2015 and 2022, a total of 14.1 GW capacity has been awarded through the auction mechanism. Wind power and solar PV have been the two favored technologies accounting for 40.8% and 33.8% respectively of the total awarded capacity between 2015 – 2022.

Saibasan added: “There has been a decline in awarded capacity from 2018 to 2022 due to reduced interest from industry participants because of rising costs and reduction in ceiling prices set by the government, making it an unattractive investment option.”

Brazil is focusing on the development of the renewable power sector to reduce its dependence on hydro plants for power generation. Within renewables, solar PV and wind power have been the core focus areas.

The government is expected to launch the first offshore wind auction in 2023 and the winning projects are slated to be operational in 2027. Between 2023 – 2035, 76.9 GW of solar PV capacity is expected to be added, whereas onshore wind capacity additions are expected to be approximately 17.8 GW.

Saibasan concluded: “Auctions are crucial for Brazil to achieve its renewable generation target and emission reduction target. Brazil has set a target to achieve 45% renewable power in the energy mix and 23% renewable power in electricity generation by 2030.

“The government should look for ways to maneuver around the current challenges and make the auction scheme more attractive. The government may look at floating price schemes or contracts for difference (CfD) schemes to protect renewable power developers from rising costs as well as protect itself from overcompensating once the global energy crisis subdues.”


Published by , Editorial Assistant
Energy Global

10 Investing Concepts Beginners Need to Learn

Key Attitudes and strategic frameworks for Intelligent and successful investors…

Getting started as an investor can be a daunting task. According to the 2022 Investopedia Financial Literacy Survey, 57% of U.S. adults are invested, but just one in three say they have advanced investing knowledge. Getting started can be especially daunting if you are a methodical person who is cautious about commencing such an important undertaking before you have acquired sufficient knowledge, expertise, and confidence.

Meanwhile, creating a short list of everything that a beginning investor should know inevitably runs the risk of excluding many vital points. Indeed, successful investors are bound to differ widely on what they would include in their top ten lists if they were pressed to replicate this exercise.

That said, we offer what we hope is a useful checklist to help you get started as a successful investor. We have chosen to emphasize key personal attitudes and overarching strategic frameworks that, in our opinion, will help you to become an intelligent investor.

KEY TAKEAWAYS
  • Have a plan, prioritize saving, and know the power of compounding.
  • Understand risk, diversification, and asset allocation.
  • Minimize investment costs.
  • Learn classic strategies, be disciplined, and think like an owner or lender.
  • Never invest in something you do not fully understand.


The first step toward becoming a successful investor should be starting with a financial plan—one that includes goals and milestones. These goals and milestones would include setting targets for having specific amounts saved by specific dates.

The goals in question might include, for example, having enough savings to facilitate buying a home, funding your children’s education, building an emergency fund, having enough to fund an entrepreneurial venture, or having enough to fund a comfortable retirement.

Moreover, while most people think in terms of saving for retirement, an even more desirable goal would be to achieve financial independence at as early an age as possible. A movement devoted to this goal is Financial Independence, Retire Early (FIRE).

While it is possible to create a solid financial plan on your own, if you are new to the process, you might consider enlisting professional help from someone such as a financial advisor or financial planner, preferably one who is a Certified Financial Planner (CFP®). Finally, do not delay. Seek to have a plan in place as early as possible in your lifetime, and keep it a living document, updated regularly and in light of changed circumstances and goals.


2. Make Saving a Priority

Before you can become an investor, you must have money to invest. For most people, that will require setting aside a portion of each paycheck for savings. If your employer offers a savings plan such as a 401(k), this can be an attractive way to make saving automatic, especially if your employer will match all or part of your own contributions.

In setting up your financial plan, you also might consider other alternatives for making saving automatic, in addition to utilizing employer-sponsored plans. Building wealth typically has aggressive saving at its core, followed by astute investing aimed at making those savings grow.

Also, a key to saving aggressively is living frugally and spending with caution. In this vein, a wise adjunct to your financial plan would be creating a budget, tracking your spending closely, and regularly reviewing whether your outlays are making sense and delivering sufficient value. Various budgeting apps and budgeting software packages are available, or you can choose to create your own spreadsheets.


3. Understand the Power of Compounding

Saving and investing on a regular, systematic basis and starting this discipline as early as possible in life will allow you to take full advantage of the power of compounding to increase your wealth. The current protracted period of historically low interest rates has diminished the power of compounding to some extent, but it also has made starting early to build savings and wealth more imperative, since it will take interest-bearing and dividend-paying investments longer to double in value than before, all else equal.


4. Understand Risk

Investment risk has many aspects, such as default risk on a bond (the risk that the issuer may not meet its obligations to pay interest or repay principal) and volatility in stocks (which can produce sharp, sudden increases or decreases in value). Additionally, there is, in general, a tradeoff between risk and return, or between risk and reward. That is, the route to achieving higher returns on your investments often involves assuming more risk, including the risk of losing all or part of your investment.

As a critical part of your planning process, you should determine your own risk tolerance. How much you can be prepared to lose should a prospective investment decline in value, and how much ongoing price volatility in your investments you can accept without inducing undue worry, will be important considerations in determining what sorts of investments are most appropriate for you.

Risk

At its most basic level, investment risk includes the possibility of a complete loss. But there are many other aspects to risk and its measurement.

5. Understand Diversification and Asset Allocation

Diversification and asset allocation are two closely related concepts that play important roles both in managing investment risk and in optimizing investment returns. Broadly speaking, diversification involves spreading your investment portfolio among a variety of investments, in hopes that subpar returns or losses in some may be offset by above average returns or gains in others. Likewise, asset allocation has similar goals, but with the focus being on distributing your portfolio across major categories of investments, such as stocks, bonds, and cash.

Once again, your ongoing financial planning process should revisit your decisions on diversification and asset allocation regularly

6. Keep Costs Low


You cannot control the future returns on your investments, but you can control the costs. Moreover, costs (e.g., transaction costsinvestment management feesaccount fees, etc.) can be a significant drag on investment performance. Similarly, taking mutual funds as just one example, high cost is no guarantee of better performance.

The Importance of Costs

Investment costs and fees are often a key determinant of investment results.


7. Understand Classic Investment Strategies

Among the investment strategies that the beginning investor should understand fully are active versus passive investingvalue versus growth investing, and income-oriented versus gains-oriented investing.

While savvy investment managers can beat the market, very few do it consistently over the long term. This leads some investment pundits to recommend low-cost passive investing strategies, mainly those utilizing index funds, that seek to track the market.

In the realm of equity investing, value investors prefer stocks that appear to be relatively inexpensive compared to the market on measures such as price-earnings ratios (P/E), expecting that these stocks have upside potential as well as limited downside risk. Growth investors, by contrast, see greater opportunity for gain among stocks that are recording rapid increases in revenues and earnings, even if they are relatively expensive.

Income-oriented investors seek a steady stream of dividends and interest because they need the ongoing spendable cash, they see this as a strategy that limits investment risk, or both. Among the variations of income-oriented investing is focusing on stocks that offer dividend growth.

Gains-oriented investors are largely unconcerned about income streams from their investments and instead look for the investments that seem likely to deliver the most price appreciation in the long term.


8. Be Disciplined

If you are investing for the long term, according to a well-thought and well-constructed financial plan, stay disciplined. Try not to get excited or rattled by temporary market fluctuations and panic-inducing media coverage of the markets that might border on the sensationalistic. Also, always take the pronouncements of market pundits with a grain of salt unless they have lengthy, independently verified track records of predictive accuracy. Few do.


9. Think Like an Owner or Lender

Stocks are shares of ownership in a business enterprise. Bonds represent loans extended by the investor to the issuer. If you intend to be an intelligent long-term investor rather than a short-term speculator, think like a prospective business owner before you buy a stock, or like a prospective lender before you buy a bond. Do you want to be a part owner of that business, or a creditor of that issuer?


10. If You Don’t Understand It, Don’t Invest in It

Given the proliferation of complex and novel investment products, as well as of companies with complex and novel business models, beginning investors today are faced with a vast array of investment choice that they may not fully understand. A simple and wise rule of thumb is never to make an investment that you do not fully understand, particularly when it comes to its risks. A corollary is to be very careful about avoiding investing fads, many of which may not stand the test of time.

Avoid investments you don’t fully understand. They may present large hidden dangers.
What Do I Need to Know Before Investing?

Before investing, it is critical to know what your goals and objectives are. Whether it be to fund retirement, purchase a home, or undertake a new business venture, knowing what you’re working towards will help you choose an investment to help you meet your goals. It is also important to know the basics about investing—such as risks, fees and costs, and investment strategies—and understand the investment you’re prospecting.

What Are the 4 Main Types of Investments?

While there are many investment categories, the four basic types are stocks, bonds, mutual funds, and exchange-traded funds (ETFs). Stocks are shares of ownership in a company. Bonds are essentially loans made by the investor to the issuer, who promises to pay the principal at maturity and interest over the bond’s term. Mutual funds are funds in which multiple investors pool their money together to purchase stocks or other securities, and ETFs are like mutual funds but are traded on national stock exchanges.

Is $100 Enough to Start Investing?

Many prospective investors believe they must have a lot of money to begin investing. However, many investments have low thresholds, giving new investors opportunities to start their journey. You can begin investing with $100 or less. For instance, you could purchase shares or fractional shares of stock, use a robo-advisor to invest based on your goals, contribute to a retirement plan, or invest in a mutual fund. The options are plenty.


The Bottom Line

As a new investor, choosing the right investments or investment strategy can be intimidating, and the advice on how to proceed is as diverse as the selection of investments from which to choose. Despite the innumerous recommendations, building your knowledge and having a solid understanding of investing and your goals is key to making informed decisions that will likely yield favorable results.

Investopedia

INTERNATIONAL ENERGY OUTLOOK-EIA

GLOBAL NATURAL GAS PRODUCTION CONTINUES TO INCREASE AT A STEADY RATE ACROSS THE PROJECTION PERIOD, FOLLOWING PRODUCTION GAINS IN THE LAST DECADE

In the Reference case, global natural gas production steadily increases, growing by approximately 30% between 2020 and 2050. Before that, natural gas production grew by 25% between 2010 and 2020, with the aid of new recovery techniques and expanded infrastructure. Projected growth in global natural gas demand and the expansion of processing and transportation infrastructure around the world drives growth in natural gas production to 2050.

In addition, demand from the industrial sector—for both natural gas and NGPLs—supports growth in natural gas production, while growth is more limited in the electric power, transportation, and residential and commercial sectors. Although use of natural gas for electric power generation increased by almost 30% from 2010 to 2020, this growth will likely plateau in 2030. The role of natural gas in the electric power sector has become increasingly complex because of economic and policy trends that favor renewable energy.

Some future growth in natural gas production will likely coincide with crude oil production growth because crude oil production from low permeability, tight rock formations produces associated-dissolved natural gas (also called associated gas) which, in some areas, is captured and processed.

Figure 38.

Figure 38
THE UNITED STATES, RUSSIA, AND THE MIDDLE EAST REMAIN THE LARGEST NATURAL GAS PRODUCERS AND EXPORTERS THROUGH 2050

Figure 39.

Figure 39


The United States, Russia, and the Middle East are currently the largest producers of natural gas. In the Reference case, all three will continue to expand production throughout the projection period, and the United States will remain the largest producer worldwide, producing almost 43 trillion cubic feet (Tcf) in 2050.

The United States, Russia, and the Middle East all have large proven reserves of both natural gas and oil, along with the accompanying processing and transportation infrastructure to support steady production levels. In addition to meeting domestic demand, growing production in these regions serves growing demand for natural gas in the global market. The three largest producing regions all export more natural gas than they import; their exports go to key regions in Europe and Asia, where demand is greater than domestic supply. We project that the demand for natural gas from these regions grows further. The United States’ and Russia’s natural gas production grows by about 10 Tcf between 2020 and 2050 in the Reference case. Middle East natural gas production grows by about 5 Tcf over the same period.

Figure 40.

Figure 40

In the Reference case, Russia, the United States, and the Middle East will all grow as net exporters throughout the projection period to provide natural gas to European and Asian markets. Russia, in particular, shows the most growth in net exports, more than doubling over the projection period to remain the largest net exporter of natural gas through 2050 at more than 14 Tcf. Because it is near Europe, China, and the rest of non-OECD Asia, Russia’s net natural gas exports will grow through established pipeline infrastructure, potential future pipeline additions, and liquefied natural gas exports. The United States also shows rapid growth in net exports over the next 10 years, as it continues to expand its LNG infrastructure and produce natural gas at high volumes. LNG terminals and transportation vessels facilitate the overseas transport of natural gas between regions that are not connected by pipeline, creating an outlet for natural gas produced in the United States and the Middle East to reach overseas markets where it is in the highest demand.

KEY DESTINATIONS FOR NATURAL GAS EXPORTS ARE EUROPE AND ASIA, AND NON-OECD ASIA GROWS THE MOST

Figure 41.

Figure 39

In 2020, OECD Europe was the largest importer of natural gas, followed by Japan, South Korea, and non-OECD Asia. All of these regions are net importers due to their limited domestic supply of natural gas relative to their growing demand. These regions remain the largest natural gas export destinations through the projection period.

In the Reference case, both non-OECD Asia and OECD Europe increase their use of imported natural gas, and non-OECD Asia grows to become the largest net importer of natural gas by 2050—driven by continued economic growth in China and India. Net imports of natural gas into China, India, and other non-OECD Asian nations more than triple by 2050. Supply of natural gas in these markets arrives both via pipeline and as LNG exports from Russia. The regions also receive LNG exports from regions such as the United States, the Middle East, Australia, and Africa.


EIA

Reshoring Supply Chains: What does it mean for Investors?

Of all the lessons learned during the pandemic — wash your hands thoroughly, avoid crowded elevators, working from home can be productive — perhaps the most consequential lesson for companies is now obvious in hindsight: Relying on single links in the global supply chain was a mistake.

Major components of the supply chain fractured during the COVID-19 crisis, resulting in shortages of everything from medical supplies and equipment to furniture and auto parts. Geopolitical events also entered the fray as U.S.-China tensions and Russia’s invasion of Ukraine underscored the risks of relying too much on one place for critical supplies, including energy, food and computer chips.
“With the rapid spread of globalization over the past few decades, companies moved their manufacturing operations to the cheapest and most efficient countries,” says Julian Abdey, a portfolio manager with The Growth Fund of America®.
“That was great for company profits and consumer prices,” he continues. “But what we found out more recently is that when supply chains get disrupted it can cause real problems. For example, Europe has realized it was too dependent on Russia for natural gas. And I think the same is true for other products like computer chips. The world is too dependent on Asia, and Taiwan in particular, for semiconductors.”
Reshoring replaces offshoring
Fast forward to 2023, and many companies — in some cases spurred by massive government subsidies — are taking big steps to diversify their supply chains, focusing on reliability and robustness over cost and efficiency. That means bringing some manufacturing back home, or “reshoring” and moving some of it to other countries.
The trend has raised questions about whether the world is moving into a period of de-globalization. However, based on trade activity in recent years, the new path looks more like a measured adjustment to global supply chains, partially interrupted by the pandemic and the 2007–2009 financial crisis.

Globalization marches on — at a different pace


The image shows the generally rising path of world trade over the past five decades, expressed as a percent of global gross domestic product (GDP). Trade activity rises sharply from around 25% in 1970 to above 60% in 2007, then slows afterward. For reference purposes, the image also shows major events along the same timeline, including the U.S. decision to abandon the gold standard in 1971, the collapse of the Soviet Union in 1991, the adoption of the North American Free Trade Agreement in 1994, the September 11 terrorist attacks in 2001, the global financial crisis from 2007 to 2009 and the COVID-19 pandemic from 2020 to 2023.

Sources: Capital Group, Organization for Economic Co-operation and Development (OECD), World Bank. World trade is calculated as the sum of exports and imports of goods and services and is represented above as a share of global gross domestic product. Trade data as of 2021.

“When we talk to companies and look at the data, we are not seeing what I would call de-globalization,” says Rob Lovelace, a portfolio manager with New Perspective Fund®. “I think it would be more accurate to call it a rewiring of global supply chains. And I don’t think it’s really all that dramatic when you consider the rapid growth of digital trade, which is harder to track using traditional metrics, as opposed to physical trade.”

In fact, there is ample evidence that many companies are becoming more global as they seek to create redundant supply chains. The poster child for this development is Taiwan Semiconductor Manufacturing Company or TSMC, the world’s largest semiconductor foundry. To expand its global reach, TSMC is building new manufacturing plants in Arizona and Japan. Semiconductors have become such a sensitive issue, given their use in the defense industry, that the U.S. government has placed aggressive restrictions on where and how they can be exported.
Other examples abound in the tech sector and elsewhere. Apple announced in September that it would start producing the iPhone 14 in India, adding to its manufacturing capabilities in China, the Czech Republic and South Korea among others. In the auto sector, Tesla added to its U.S. and China manufacturing hubs last year by opening its first European outpost in Gruenheide, Germany.
In the energy sector, Texas-based ECV Holdings has announced plans to build a power plant for industrial parks near Ho Chi Minh City, Vietnam, supplied primarily by U.S. liquified natural gas. Meanwhile, the list of U.S. companies establishing new manufacturing plants at home has grown dramatically in recent years to include General Motors, Intel and U.S. Steel — fueling hopes of an American industrial renaissance.
The China+1 strategy
Amid this drive to diversify supply chains, a common misconception is that China may be displaced as the world’s largest manufacturing base. Rather, many companies are shifting to a “China+1 strategy” by maintaining operations in China while adding new facilities elsewhere, says Winnie Kwan, a portfolio manager with New World Fund®. Incremental investments in China are likely to focus on serving mainly the domestic market, she notes, while additional investments in other locations cater to the rest of the world.
“A key question is whether the China+1 strategy will be scalable or not,” Kwan says. “Can you add a new plant in India or Mexico, for example, and scale up production as needed? Is the labor and power supply sufficient? Is logistics infrastructure in place? Can management handle the added complexity? Those are the questions I am focusing on as we research these developments and look for investment opportunities. Not every company is going to get it right.”
Indeed, the flow of incremental investments is an important metric for investors to track. According to a 2021 survey of foreign companies doing business in China conducted by AmCham Shanghai, the top destinations for redirected investments were Southeast Asia, Mexico, India and the United States. However, only 63 of the 338 companies surveyed said they had such plans, which suggests the process of reshoring may be slower and more deliberate than some market participants are expecting.
“It could take a decade for companies to fully transition,” she adds. “But the process has certainly started, and I think it will be one of the more important investment themes of the 2020s.”

Southeast Asia is well positioned for the rewiring of global supply chains


The image shows the top destinations companies are choosing when redirecting investments from China. According to a survey by AmCham Shanghai, 50.8% of redirected investments from China are going to Southeast Asia, 34.9% are going to Mexico, 30.2% are going to India and 22.2% are going to the United States.

Source: AmCham Shanghai 2021 China Business Report, published September 22, 2021. Based on a survey of 338 foreign companies doing business in China. Of those companies, 63 said they were redirecting investments from China to other locations, including Southeast Asia, Mexico, India and the United States, among others.

Who benefits from reshoring?

With such a large undertaking, the investment implications are widespread across a number of sectors and geographies. Here are four areas expected to benefit from reshoring in the years ahead.
1. India Thanks to its proximity to China, a well-educated labor force, and a fast-growing, business-friendly economy, India may be the best-positioned country to capitalize on supply chain diversification. India’s government has taken bold steps to encourage the expansion of manufacturing operations, particularly in the smartphone space, where Apple works with contractors such as Foxconn to build the latest iPhones. The manufacturing sector is expected to accelerate over the next decade, driving growth in the Indian economy and boosting other industries such as banking, energy and telecommunications.
“India is arguably better positioned today than China was 20 years ago,” says Capital Group equity analyst Johnny Chan.
2. Mexico Similar to India, Mexico’s proximity to one of the world’s largest economies makes it an attractive base for expanded manufacturing and logistics operations. Many U.S. companies flocked there in the 1990s after the adoption of the North American Free Trade Agreement (NAFTA). That process has only accelerated under a revamped trade deal, the U.S./Mexico/Canada Agreement (USMCA), ratified in 2020.
Mexico’s annual exports to the U.S. have increased sharply in recent years. Although much of that is due to the influence of American companies, China is also ramping up in Mexico. For example, Hisense Group, one of China’s largest appliance makers, is currently building a $260 million industrial park in Monterrey, aiming to produce refrigerators, washing machines and air conditioners for the U.S. market. In the auto sector, BMW and Nissan have also recently expanded their capabilities south of the border.
3. Automation providers One of the biggest hurdles to diversifying the world’s manufacturing capabilities is a chronic labor shortage, especially in developed economies. Automation powered by artificial intelligence (AI) is likely to provide an answer to this problem, says Mark Casey, a portfolio manager with The Growth Fund of America®. Many Asian countries are setting the trend with high rates of industrial automation, with the U.S. and Europe expected to follow. Both regions have room to grow, proving a bright outlook for top companies in the global robotics industry, including Japan’s Keyence, France’s Schneider Electric and Switzerland’s ABB Ltd. Amazon is also developing its own impressive AI-driven technology, Casey notes.
“Amazon has a new robotic picking-and-packing device called Sparrow that can grab more than 60 million different products and pack them into shipping boxes — completing each pick in a matter of seconds,” Casey says. “Just seven years ago Amazon’s experimental robots could handle only a small number of items, and each pick would take a couple minutes. I think this sort of technology is coming along sooner than we think, and I don’t see it accounted for in the stock prices of any major American or European company.”

The bar chart shows the annual installations of industrial robots in Asia/Australia (navy blue), Europe (light blue) and the Americas (green) in 2020 and 2021, and projected installations for 2022, 2023, 2024 and 2025. In Asia/Australia, the annual installation of industrial robots was 277,000 in 2020, and 381,000 in 2021, and is expected to reach 416,000 by 2022, 448,000 by 2023, 484,000 by 2024, and 525,000 units by 2025. In Europe, the annual installation of industrial robots was 68,000 in 2020, and 84,000 in 2021, and is expected to increase to 87,000 in 2022, and 90,000 in 2023, before dropping slightly to 88,000 in 2024, and then increasing back to 90,000 units by 2025. In the Americas, the annual installation of industrial robots was 39,000 units in 2020, and 51,000 in 2021, and is expected to increase to 56,000 in 2022, 66,000 in 2023, and 70,000 in 2024, before dropping to 65,000 units by 2025.

Sources: Capital Group, International Federation of Robotics. As of 2022.

4. Multinationals Although it may seem counterintuitive, the same multinational companies that benefited most from the rapid pace of globalization in the past may be best equipped to navigate the brave new world of re-globalization, says Jody Jonsson, also a portfolio manager with New Perspective Fund. The world’s largest and most dominant companies rose to that position for a reason — they often have the experience and resources to adapt to changing trade patterns better than smaller companies operating in single markets.

“In my view, well-managed multinational companies will remain global in their production facilities and customer bases, but they will increasingly build more local redundancy into their operations,” Jonsson says. “I call it ‘multi-localization.’ That includes bringing some parts of the supply chain back to the U.S., continuing to outsource other parts and establishing new production facilities in key areas throughout the world.
“If there is one lesson, we’ve learned from the COVID crisis, it’s that companies must have diverse supply chains,” she adds. “We aren’t there yet, but the process is well underway.”

Julian Abdey is an equity portfolio manager with 27 years of investment industry experience (as of 12/31/2022). He holds an MBA from Stanford and an undergraduate degree in economics from Cambridge University.

Rob Lovelace is vice chair and president of Capital Group as well as an equity portfolio manager with 37 years of investment experience (as of 12/31/2022). He holds a bachelor’s degree in mineral economics from Princeton University. He also holds the Chartered Financial Analyst® designation. 

Winnie Kwan is an equity portfolio manager with 26 years of investment experience (as of 12/31/2022). She holds master’s and bachelor’s degrees in economics from Cambridge.


Learn more about

PROJECT TRACKING REVIEW: TOP 10 US WIND DEVELOPERS

ENERGY ANALYTICS POWER AND RENEWABLES

The U.S. consists of one of the largest and fastest-growing wind industries. The U.S. Department of Energy (DOE) is focused on investing in research and development projects for both onshore and offshore wind, supporting continued innovation, new job opportunities and driving economic development. The wind industry represents a vital part of the national energy strategy to reduce carbon emissions and support a transition to a clean energy future.

In 2021, the U.S. had 12,373 megawatts of newly installed wind capacity, bringing the national total to just under 140,000 megawatts. Declining costs and continued progression in the performance of wind technologies have enhanced the economics of these projects.

Wind energy now generates more than 10% of electricity in 16 states and more than 30% in Iowa, Kansas, Oklahoma and the Dakotas. The capacity factor, a ratio of energy a turbine can produce compared to the amount it could generate at its peak, suggests that wind power operations in the U.S. have improved significantly. Some of the most notable gains are in the “wind belt” region, an area expanding from the Dakotas to Texas, renowned for receiving large amounts of wind. A significant proportion of this gain is due to improvements in wind turbine technology and expanding blade and tower sizes. While the wind belt region remains a top priority for wind development nationwide, the emerging trend of larger structures has enabled wind operators to develop sites elsewhere with lower average wind speeds. There may be higher initial costs associated with constructing more substantial turbines but based on a price-per-watt basis, it is cheaper in the long term and generates a more efficient level of energy production.

These industry developments and continued progress are making wind energy far more affordable. In 2009, the average price of wind power purchase agreements in the U.S. peaked at $70 per megawatt-hour. Today in the wind belt region, the figure stands at approximately $20, and on average, $30 for other locations elsewhere.

Offshore wind development plans in the U.S.

Driven by a continued decline in offshore wind project costs, government incentives and commitments, the U.S. offshore wind pipeline increased by 24% over the last year, with more than 35,000 megawatts of offshore wind projects currently in various stages of development. The Vineyard Wind 1 in Massachusetts represents the first commercial-scale offshore wind project to gain approval in the U.S. There are now 15 offshore projects that have progressed to a permitting stage.

The Biden Administration has committed to reaching net-zero emissions by 2050. This goal requires a significant expansion of renewable energy. The National Renewable Energy Laboratory has pointed to the U.S. offshore wind industry as having the potential to provide over 2,000 gigawatts of generating capacity, approximately double the electricity consumed annually nationwide.

The DOE has set a target of 30 gigawatts of offshore wind in operation by 2030. Today’s current offshore wind capacity stands at just a little over 40 megawatts, so there is still a long way to go. Industry experts believe that offshore wind combined with the necessary strategic planning can create job opportunities and support further economic development in much-needed regions.

Below is a chart of the top 10 U.S. wind developers by megawatt within our Enverus Power & Renewables platform. Each business listed represents a critical contribution to the future growth and development of the U.S. wind industry.

Figure 1: Top 10 U.S. Wind Developers by Megawatt of Total Wind Capacity

Graph showing Top 10 US Wind Developers by Megawatt of Total Wind Capacity
Source: Enverus Power & Renewables

Figure 2: Wind Capacity by Currently Operating, Under Construction and Pre-Construction

Graph showing Wind Capacity by Currently Operating, Under Construction and Pre-Construction
Source: Enverus Power & Renewables

Top 10 Wind Developers in the U.S.

RANK DEVELOPER OPERATING UNDER CONSTRUCTION PRE-CONSTRUCTION TOTAL
1 NextEra Energy Resources 19,601 1,633 6,653 27,887
2 Invenergy 12,079 2,284 4,683 19,046
3 APEX Clean Energy 6,946 0 9,187 16,133
4 Avangrid Renewables 7,865 1,052 5,435 14,352
5 EDF Renewable Energy 7,443 393 4,492 12,328
6 Orsted 4,307 567 6,802 11,676
7 EDP Renewables 8,536 250 523 9,309
8 Equinor 0 0 8,532 8,532
9 Tradewind Energy 5,293 315 1,102 6,710
10 E.ON Climate & Renewables 4,730 441 989 6,160

Fintech Market of Iraq


One of the most significant worldwide developments during Covid-19 was the increase in consumer engagement in financial markets, many for the first time especially in Iraq. The coronavirus outbreak has acted as a catalyst for a digital revolution facilitated by financial technology (fintech).

As Iraq recovers from the Covid-19 epidemic, the city’s technology industry is booming with enthusiasm in the “new normal” economy, assisting corporations and people in tackling new business models.

In the rest of the world contactless payment has risen significantly, more People are adopting digital payment in their daily lives. Except for Iraq which still lacks the will power of the people to use Bank Cards in the first instance to make payments, this is due to lack of confidence in the financial regulations in Iraq.

The fintech space is not subject to specific legislative and regulatory provisions in Iraq as this is a new and emerging Market.

Fintech Entities are subject to specific complex ambiguous laws and regulations applying to banks, financial institutions, and insurance companies if they carry out such regulated activities.

Entities must seek legal guidance before operating in Iraq to determine any special registration or authorization requirements, which vary depending on whether the fintech engages in a regulated business such as electronic payment services, which requires a license from the Central Bank of Iraq.

When considering operating in the FinTech Market of Iraq, it’s best to consider the below legal Acts and precedents.

Iraqi Banking laws and regulations:

  • Central Bank of Iraq Regulation (28/2/1994);
  • Central Bank Law (56/2004);
  • Banking Law (94/2004);
  • Financial Investment Companies Regulation (6/2011);
  • Central Bank of Iraq Regulation (611/14 of 2019)
  • Central Bank of Iraq Regulation (1/2018) as amended by Regulation 30/12/2019.

Iraqi Technology laws and regulations:

  • E-signature and E-transactions Law (78/2012); and
  • Electronic Payment Services System Regulation (3/2014)

Iraqi Technology laws and regulations:

  • E-signature and E-transactions Law (78/2012); and
  • Electronic Payment Services System Regulation (3/2014);

Other Iraqi laws and regulations:

  • Civil Code (40/1951);
  • Penal Code (111/1969);
  • Companies Law (21/1997);
  • Capital Markets Interim Law (74/2004);
  • Insurance Business Regulation (10/2005);
  • Consumer Protection Law (1/2010); and
  • Anti-money Laundering and Counter-Terrorism Financing Law (39/2015).

Iraq has not enacted a specific law to govern the fintech space but there are some legal doctrines which may apply to certain regulated activities carried out by fintech entities, e.g., “The provision of electronic payment services”. Based on the Electronic Payment Services System Regulation (3/2014), the providers of electronic payment services must obtain a license from the Central Bank of Iraq (CBI).

The Supplier

The Central Bank of Iraq should issue a license to the supplier of such services. The license is valid for five consecutive years and can be renewed by the Provider by submitting a written request to the Central Bank of Iraq 90 days before the license expires.

The Supplier must be a legal entity that has the organizational and technical skills to operate the required mechanism, takes all measures to secure and protect electronic transactions, ensures that the Central Bank of Iraq can enter the used system at any time for supervision and control purposes, and has submitted an economic feasibility study to the Central Bank of Iraq.

The Benefactor may designate an agent or agents and authorize them to provide electronic payment services. The Provider must disclose to the Central Bank of Iraq all agent information, including name, address, internal control methods utilized by the agent, description of the services supplied by the agent, and any other information deemed required by the Central Bank of Iraq. The agent’s identity will be entered in a public record at the Central Bank of Iraq, and the Provider is required to notify the Central Bank of Iraq of any changes connected to the agent to be corrected in the above-mentioned record. The following duties of the Provider are specified in Article 16 of the Regulation (list of duties are provided in Annex 1).

If the Benefactor offers electronic payment services through mobile phone “App”, he is required to

  • Sign formal agreements with mobile operators and send copies to the CBI.
  • The payment procedure will take place within Iraq and in local currency which is Iraqi Dinars (IQD).
  • Account settlement via the instantaneous overall settlement system, or through a guarantor bank in the absence of a settlement bank account.

Responsible authority to enforcing the applicable laws and regulations?

  • The CBI is responsible for granting licenses to institutions that conduct banking operations and to electronic payment service providers.
  • The Iraq Securities Commission is responsible for supervising the Iraq Stock Exchange and issuing laws relating to investment management activities and investment advice for brokers, banks, and securities companies.

As outlined by the Decision 14/611 of 2019 on governance and institutional management of information and communication technology in the banking industry, the Central Bank of Iraq has taken a favorable stance toward fintech. When interacting with cloud computing service providers, this judgment establishes certain standards that banks, financial institutions, and other licensed institutions must follow. Furthermore, the Electronic Payment Services System Regulation (3/2014) allows non-bank payment service providers to offer electronic payment services subject to a license from the Central Bank of Iraq.

The Iraqi Central Bank has a negative perception on the use of cryptocurrency. It barred the usage of cryptocurrencies, which are subject to sanctions under the Anti-Money Laundering and Counter-Terrorism Financing Law.

Fintech Industry in Iraq

The fintech business in Iraq will become massive in the upcoming years however it is currently limited to a few sub-sectors.

Online shopping, trading and electronic services, and smartphone applications are some of the “Hot” growing Information system fields that are maturing progressively.

In comparison to other nations in the middle east, Iraq is sluggish to adopt fintech, and overall investment in fintech market and the passage of associated regulations is low. This is attributable to a variety of reasons, including the following:

  • The significant number of the unbanked population – according to a World Bank Group only 23% of Iraqi households have access to a financial institution’s account. However, we do see a change regarding government employees who are now getting paid Via Master Card & bank accounts rather than the old cash payment procedure.
  • The relative cost of internet and mobile services to income, which limits demand for digital financial services.
  • Due to worries about the security of online payments, Iraqis prefer cash on delivery in e-commerce transactions.

Although the use of mobile and electronic payment systems is growing, it is still not as widespread as it is in other nations in the region. Cash payment up on delivery when ordering goods online and money transfer “hawala” are the most prevalent payment options, with credit cards being used infrequently. Iraq’s primary underdeveloped areas are e-commerce (food, real estate, shipping, transportation, and travel services), e-banking, and digital payments.

Managing deposits and cash withdrawals through automated teller machines (ATMs), as well as executing electronic debit and credit payments, are among the electronic payment services authorized in Iraq. These electronic payments are performed using any type of digital communication and information technology, such as a network operator acting as a middleman between the user and the service provider, or any other receiver, via mobile phone transfers.

Electronic payment service providers with an Iraqi license may also facilitate to acquire bank loans that are delivered directly to the user’s credit card.

The typical structure of fintech companies

The E-signature and E-transactions Law governs electronic transactions in Iraq. Online and technology enterprises, on the other hand, are not regulated in Iraq. This means that unless they have a physical office address in Iraq, e-commerce sites and mobile applications are not legally deemed enterprises. As a result, most tech start-ups choose to register their firms as “bricks and mortar” businesses in order to gain legal legitimacy.

Fintech services are also supplied by banks that operate under the supervision of the Iraqi Central Bank (CBI).

Regulations

Article 27 of the Electronic Signature & Electronic Transactions Law No. 78 of 2012, which states that the electronic transfers of money should be regulated by a regulation that to be suggested by the Central Bank of Iraq (CBI), the Iraqi Council of Ministers issued Regulation No. 3 of 2014 regarding the Electronic Payment Services of Money (The “Regulation”).

This Regulation covers all the electronic payment activities including issuing the electronic payment tools, managing the deposits and cash withdrawals through ATMs and selling points, implementing of electronic payment processes (payable and receivable) that their money be guaranteed by the credit of the services user or by any means of digital communications or information technology, and implementing of electronic payment processes in accordance with the overall settlement system or the clearing mechanism system.

-Iraqi business news


Alternative Fuels

Alternative fuels are derived from sources other than petroleum. Most are produced domestically, reducing our dependence on imported oil, and some are derived from renewable sources. Often, they produce less pollution than gasoline or diesel.

E85 Pump Label

Ethanol is produced domestically from corn and other crops. It produces less greenhouse gas (GHG) emissions than gasoline or diesel.

Electric charging sign

Electricity is produced domestically from a variety of sources such as coal, natural gas, nuclear power, and renewables. Powering vehicles with electricity causes no tailpipe emissions, but generating electricity can produce pollutants and greenhouse gases.

Biodiesel Logo

Biodiesel is diesel derived from vegetable oils and animal fats. It usually produces less air pollutants than petroleum-based diesel.

CNG Logo

Natural gas is a fossil fuel that is plentiful in the U.S. It produces less air pollutants and GHGs than gasoline.

Propane Logo

Propane, also called liquefied petroleum gas (LPG), is a domestically abundant fossil fuel. It produces less harmful air pollutants and GHGs than gasoline.

DOE Hydrogen Program Logo

Hydrogen can be produced domestically from fossil fuels (such as coal), nuclear power, or renewable resources, such as hydropower. Fuel cell vehicles powered by pure hydrogen emit no harmful air pollutants.

Alternative Fuel Corridors

The Federal Highway Administration (FHWA) recently announced the designation of the nation’s first alternative fuel corridors for electric, hydrogen, natural gas, and propane vehicles. With this designation, FHWA is facilitating the creation and expansion of a national network of alternative fueling and charging infrastructure along national highway system corridors. This is the next step in advancing America’s 21st century transportation network. For more information on these corridors, including maps and additional resources, please visit the FHWA website at:
http://www.fhwa.dot.gov/environment/alternative_fuel_corridors.

U.S. Department of Energy and the U.S. Energy and the U.S. Environmental Protection Agency

What are Emerging Markets?

“Emerging markets” is a term that refers to an economy that experiences considerable economic growth and possesses some, but not all, characteristics of a developed economy. Emerging markets are countries that are transitioning from the “developing” phase to the “developed” phase.

Characteristics of Emerging Markets

Emerging Markets

Some common characteristics of emerging markets are illustrated below:

1. Market volatility

Market volatility stems from political instability, external price movements, and/or supply-demand shocks due to natural calamities. It exposes investors to the risk of fluctuations in exchange rates, as well as market performance.

2. Growth and investment potential

Emerging markets are often attractive to foreign investors due to the high return on investment they can provide. In the transition from being an agriculture-based economy to a developed economy, countries often require a large influx of capital from foreign sources due to a shortage of domestic capital.

Using their competitive advantage, such countries focus on exporting low-cost goods to richer nations, which boosts GDP growth, stock prices, and returns for investors.

3. High rates of economic growth

Governments of emerging markets tend to implement policies that favor industrialization and rapid economic growth. Such policies lead to lower unemployment, higher disposable income per capita, higher investments, and better infrastructure. On the other hand, developed countries, such as the USA, Germany, and Japan, experience low rates of economic growth due to early industrialization.

4. Income per capita

Emerging markets usually achieve a low-middle income per capita relative to other countries, due to their dependence on agricultural activities. As the economy pursues industrialization and manufacturing activities, income per capita increases with GDP. Lower average incomes also function as incentives for higher economic growth.

The Five Major Emerging Markets

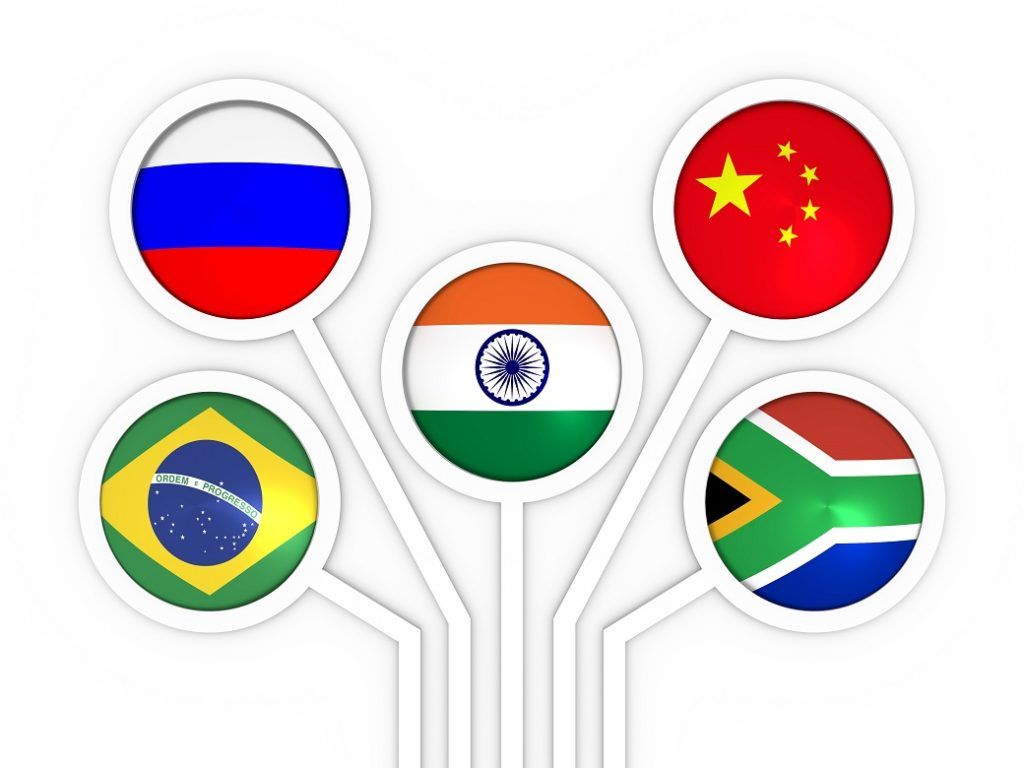
Brazil, Russia, India, China, and South Africa are the biggest emerging markets in the world. In 2009, the leaders of Brazil, Russia, India, and China formed a summit to create “BRIC,” an association created in order to improve political relationships and trade between the largest emerging markets. South Africa joined the “BRIC” group in 2010, which was then re-named “BRICS.”

BRICS

1. Brazil

Brazil’s economy on a relative basis grew rapidly during the early 2010s at a rate of 7.5%. Due to political instability and trade sanctions, however, the growth rate slowed down and became negative in 2016 (-3.5%). Brazil also experienced considerable improvements in income levels and poverty reduction in 2003-2014, but changes have been sluggish since 2015 due to lower economic activity.

The Brazilian economy has been affected largely by political uncertainties and lower government expenditure. However, the outlook for the country’s future is positive. The domestic economy grew 0.6% in 2019 and is expected to sustain the growth through infrastructure improvements and foreign investments, along with its reliance on agricultural commodities like soybean and coffee.

2. Russia

Driven primarily by oil exports and a rise in oil prices, Russia experienced exponential growth in its GDP during the period 1999-2008 (before the Global Financial Crisis). The transition from communism to capitalism that has been taking place since 1991 has boosted economic growth in the country through economic reforms and an export-oriented trade policy.

However, since 2014, Russia’s economy has been negatively affected by political conflicts and trade sanctions that have been imposed by the US, Canada, Japan, and the EU, along with fluctuations in the price of oil, which accounts for close to 52% of Russian exports. The Russian economy grew at a rate of 1.7% in 2019 and is expected to grow faster if geopolitical tensions with trade partners like the US, Canada, Japan, and the EU reduce.

3. India

India established itself as an emerging market after trade liberalization and other major economic reforms in 1991. The Indian economy has been growing steadily at relatively high rates. It averaged 7.1% in the past decade, with some fluctuations due to political instability and economic reforms.

Essentially, India’s long-term economic growth can be attributed to the expansion of the manufacturing and service sectors, driven by exports and foreign investment. India is also experiencing gains both in capital and labor productivity due to technological advancements and educational reforms. As of now, India is one of the largest emerging markets, along with China.

4. China

The Chinese economy has posted an average growth rate of 10% since the enactment of trade liberalization and economic reforms in 1978. China’s economic growth has been propelled by government spending, expansion of its manufacturing sector, and exports (specifically electronic equipment).

However, the country’s income per capita is still low. Although only 3.3% of the Chinese population lives below the poverty line, 30% of the population lives below US$5.50/day. Nonetheless, as the Chinese government focuses on increasing GDP through consumption, disposable incomes are likely to increase, leading to sustained economic growth.

5. South Africa

South Africa was inducted into the BRICS association in 2010, after experiencing negative GDP growth in 2009 following the 2008 Global Financial Crisis (-3%). Following the financial crisis, the South African government implemented a number of policies to boost GDP through government expenditure and consumption. Economic growth increased in 2010-12 before slowing down in 2012-16 and rising again in 2017.

South African exports are composed primarily of commodities from mining. Therefore, export volumes depend on the prices of commodities, which are highly volatile. Fluctuations in export volumes explain part of the variation in GDP growth over the last few years.

Although South African GDP per capita has been increasing over time, so has the unemployment rate (29% as of 2019). High levels of unemployment and crime have hindered the economy’s growth and investment potential and are issues that need to be addressed through policy reforms.

Investopedia

International Markets Outlook for 2023

There’s no doubt investors have been frustrated in recent years with the persistent lagging returns of international equities. A strong U.S. dollar, the war in Ukraine, weak economies in Europe and Japan, and various troubles in emerging markets have created a cloudy near-term outlook at best.
That said, avoiding international markets would mean ignoring some of the most successful companies in the world, simply because they lie beyond the U.S. border.
Even if you think economies outside the U.S. are headed for more trouble, there are still important reasons to consider investing in international and emerging markets companies. Here are the top five:
1. International investing is about companies, not economies.
There’s a big difference between top-down macroeconomic conditions and fundamental, bottom-up prospects for individual companies. More than ever, company-specific events are driving returns, placing added importance on deep investment research and individual stock picking.
For many multinational companies headquartered in economically struggling areas, local conditions may have little or no impact on revenues, except when it comes to regulation and taxation, explains Gerald Du Manoir, a portfolio manager with American Funds International.
“In Europe, for example, interest in Airbus has a lot to do with demand for airplanes in the U.S. and China,” Du Manoir says. “Interest in LVMH has a lot to do with U.S. consumer demand for luxury goods.
“In emerging markets,” he adds, “interest in Taiwan Semiconductor Manufacturing Company (TSMC) has a lot to do with global demand for computer chips. Granted, the outlook for some economies doesn’t look too compelling, but I feel confident that we can still find promising companies in Europe, Japan and emerging markets.”

Company-specific factors have had a large and growing impact on returns


The image shows the composition of developed market returns and emerging market returns as attributed to region and country factors, sector and industry factors, and company-specific factors. The vertical scale ranges from 0% to 100%. The horizontal scale lists the years from 1992 to 2022. The image on the left shows that in developed markets, company-specific factors grew from the low 60% range to the high 70% range. The image on the right shows that in emerging markets, company-specific factors grew from the mid-30% range to the mid-60% range.


For example: France-based Airbus is on track to deliver 700 commercial aircraft this year, about 200 more than U.S. rival Boeing. In October, France’s LVMH reported a 27% increase in third-quarter revenue, largely driven by U.S. tourists buying luxury handbags and jewelry at a discount as the euro fell against the dollar. Taiwan-based TSMC, the world’s largest chip maker, recently announced a multibillion-dollar expansion of its manufacturing capabilities in Arizona, capitalizing on U.S. government grants aimed at bringing the chip industry back to America.

“These are global companies generating revenue all over the world,” Du Manoir says.
2. The strong U.S. dollar won’t last forever.
One of the headwinds to investing overseas has been the strong U.S. dollar, which dampens returns based in other currencies when they are converted into dollars. The greenback has soared in recent years due to the relative strength of the U.S. economy, generally higher interest rates in the U.S. and the dollar’s perceived safe-haven status. Dollar strength has accelerated this year as the Federal Reserve has aggressively raised rates in a bid to tame inflation.
These conditions won’t last forever, says Capital Group currencies analyst Jens Søndergaard, who estimates the dollar is overvalued by about 20% compared to a basket of other foreign currencies. While there is no indication yet that the dollar has peaked, all eyes are on the Fed.
“Once the Fed stops raising rates, and perhaps starts cutting again, the stage could be set for a reversal of the dollar dominance we’ve seen over the past decade,” Søndergaard says. “As the global economy picks up steam, procyclical currencies should benefit, and that may also provide a more supportive environment for international equities.”
In the meantime, keep in mind that a strong dollar isn’t always bad for non-U.S. companies. Many European companies earn a substantial portion of their total revenue in dollars. In the health care sector, for example, French drugmaker Sanofi reported that currency effects boosted its sales by nearly 1 billion euros in the first half of 2022.

Many non-U.S. companies generate substantial USD-based revenue


The image shows U.S. dollar revenues expressed as a percentage that are generated by companies in various sectors of the MSCI Europe Index. Health care is the highest at 37.1%, followed by consumer staples at 26.2%, industrials at 25.6%, communication services at 20.7%, consumer discretionary at 20.3%, energy at 20.1%, information technology at 19.9%, materials at 17.4%, utilities at 11.5% and real estate at 2.2%.


3. Dividend opportunities are greater outside the U.S.

Over the past decade, investors spent little time thinking about dividends. Compared to the darlings of the internet, dividend-paying companies appeared downright boring. Well, in today’s more volatile markets, boring is beautiful, says Caroline Randall, a portfolio manager with Capital Income Builder®.

Nowhere is that sentiment more rooted than in markets outside the U.S., where dividends have historically made up a bigger part of the investment landscape. As of October 31, 2022, about 600 companies headquartered in international and emerging markets offered hefty dividend yields between 3% and 6%, compared to only 121 in the United States.
“With growth slowing, the cost of capital rising and valuations for less profitable tech companies declining, I expect dividends to be a more significant and stable contributor to total returns,” Randall adds. “They may also offer a measure of downside protection when volatility rises.”

Dividend payers multiply in international and emerging markets


The image shows the number of companies in emerging, international and U.S. markets with dividend yields from 3% to 6%. As of October 31, 2022, the U.S. had 121 of those companies, international markets had 304 and emerging markets had 295. A sidebar on the right lists a few examples: Saudi Aramco, China Merchant’s Bank and Saudi National Bank in emerging markets; Shell, Novartis and TotalEnergies in international markets; and ExxonMobil, JP Morgan Chase and Chevron in the U.S.

Non-U.S. companies that have paid steady and above-market dividends can be found across sectors, including financials, consumer staples, health care and materials. Examples include Zurich Insurance, British American Tobacco, drug maker Novartis and mining company Rio Tinto.

4. The new economy depends on old industries.
As digitally focused, e-commerce and social media companies struggle in the market downturn, investors are refocusing on old economy companies that are necessary to meet the aspirations of the new economy. Many companies in the materials, financials and industrials sectors are based outside the U.S., while technology and health care sectors are more prevalent inside the U.S.
This has been a key driver of the divergence between U.S. and non-U.S. stock returns over the past decade, fueling the dominance of U.S. tech-related companies. While there may yet be more growth to come in that area, it is certainly more mature than a decade ago.

Old economy companies play a larger role in markets outside the U.S.


The image shows the sector breakdown of the MSCI ACWI (All Country World Index) by regional exposure: non-U.S. versus U.S. The sectors are shown in the following order: materials at 65% non-U.S., financials at 52% non-U.S., industrials at 47% non-U.S., consumer staples at 44% non-U.S., energy at 42% non-U.S., utilities at 41% non-U.S., consumer discretionary at 37% non-U.S., real estate at 32% non-U.S., communication services at 30% non-U.S., health care at 28% non-U.S. and information technology at 19% non-U.S.

Investors looking to diversify from the areas that led the last bull market may want to consider going outside the U.S., where valuations tend to be lower and solid research can uncover overlooked or long-neglected gems, says Lisa Thompson, a portfolio manager with New World Fund®

“I am generally staying away from the cool kids of the last decade and looking for opportunities among the unpopular kids,” she says, noting that Europe, Japan and Latin America are good places to search for them.
“Many U.S. companies benefited greatly from globalization and a low cost of capital,” Thompson explains. “So, if those trends are now reversing — and I believe they are — then I think that bodes well for companies in other markets that haven’t benefited as much, or at all, from the prevailing trends of the past decade.”
5. Not all the best stocks are in the U.S., by a long shot.
Over the past 10 years, at a time when U.S. tech stocks were getting all the attention for their high returns, there was one fact many investors overlooked: The top 50 companies with the best annual returns each year were overwhelmingly based outside the United States.
Don’t believe it? Check out the chart.

77% of the top-returning stocks since 2013 were based outside the U.S.


The image shows the number of top 50 stocks each year from 2013 to October 31, 2022, by region. The regions are: Emerging markets (ex China), China, developed international and the United States. Over the period shown, U.S. representation among the top 50 stocks varied between three and 23. The 2013 index returns for U.S. and non-U.S. are 32.4% and 15.3%, respectively; 13.7% U.S. and –3.9% non-U.S. for 2014; 1.4% U.S. and –5.7% non-U.S. for 2015; 12.0% U.S. and 4.5% non-U.S. for 2016; 21.8% U.S. and 27.2% non-U.S. for 2017; –4.4% U.S. and –14.2% non-U.S. for 2018; 31.5% U.S. and 21.5% non-U.S. for 2019; 18.4% U.S. and 10.7% non-U.S. for 2020; 28.7% and 7.8% for 2021; –17.7% and –24.3% for 2022 year to date as of October 31, 2022. The top 50 stocks are the companies with the highest total return in the MSCI ACWI each year. Returns table uses S&P 500 and MSCI ACWI ex USA indexes for U.S. and non-U.S., respectively.

While it’s true that international equities generally have lagged U.S. markets over that same time period, the index-based returns that most investors follow don’t tell the whole story. On a company-by-company basis, the picture is significantly different. If you had decided to ignore European, Asian and other non-U.S. stocks, you would have missed many of the best opportunities.

Looking at the data in this context provides an important reminder of the benefits of maintaining a balanced, well-diversified portfolio and following a flexible investment approach.
It remains to be seen how the current decade will shape up, but it’s possible that one long-term trend will continue: On a company-by-company basis, the best annual returns each year have primarily been generated by stocks found outside the U.S. — supporting the view that the world is a stock picker’s market that often favors borderless investing.
The Capital Group


What Are Natural Gas Fuel Cells?

Fuel cells powered by natural gas are an extremely exciting and promising new technology for the clean and efficient generation of electricity. Fuel cells have the ability to generate electricity using electrochemical reactions as opposed to combustion of fossil fuels to generate electricity. Essentially, a fuel cell works by passing streams of fuel (usually hydrogen) and oxidants over electrodes that are separated by an electrolyte. This produces a chemical reaction that generates electricity without requiring the combustion of fuel, or the addition of heat as is common in the traditional generation of electricity. When pure hydrogen is used as fuel, and pure oxygen is used as the oxidant, the reaction that takes place within a fuel cell produces only water, heat, and electricity. In practice, fuel cells result in very low emission of harmful pollutants, and the generation of high-quality, reliable electricity. The use of natural gas-powered fuel cells has a number of benefits, including:

  • Clean Electricity – Fuel cells provide the cleanest method of producing electricity from fossil fuels. While a pure hydrogen, pure oxygen fuel cell produces only water, electricity, and heat, fuel cells in practice emit trace amounts of sulfur compounds and very low levels of carbon dioxide. However, the carbon dioxide produced by fuel cell use is concentrated and can be readily recaptured, as opposed to being emitted into the atmosphere.
  • Distributed Generation – Fuel cells can come in extremely compact sizes, allowing for their placement wherever electricity is needed. This includes residential, commercial, industrial, and even transportation settings.
  • Dependability – Fuel cells are completely enclosed units, with no moving parts or complicated machinery. This translates into a dependable source of electricity, capable of operating for thousands of hours. In addition, they are very quiet and safe sources of electricity. Fuel cells also do not have electricity surges, meaning they can be used where a constant, dependable source of electricity is needed.
  • Efficiency – Fuel cells convert the energy stored within fossil fuels into electricity much more efficiently than traditional generation of electricity using combustion. This means that less fuel is required to produce the same amount of electricity. The National Energy Technology Laboratory estimates that, used in combination with natural gas turbines, fuel cell generation facilities can be produced that will operate in the 1-to-20-Megawatt range at 70 percent efficiency, which is much higher than the efficiencies that can be reached by traditional generation methods within that output range.

The generation of electricity has traditionally been a very polluting, inefficient process. However, with new fuel cell technology, the future of electricity generation is expected to change dramatically in the next ten to twenty years. Research and development into fuel cell technology is ongoing, to ensure that the technology is refined to a level where it is cost-effective for all varieties of electric generation requirements.


NaturalGas.org

9 Tips for Successful End-of-Year Financial Planning

 2023 blocks with coins stacked on them. The end of the year means different things for different people as they come up with resolutions and set their intentions to improve various aspects of their lives. But there’s one thing that everyone should do as the calendar starts to move towards another January — take stock of their personal finances and make any necessary moves before the new year. Here’s what you need to do before the end of the year to make the most of your personal finances.
  • Go over your financial plan: A lot can happen in a year. You may have made a major purchase, gotten a raise or gone on a vacation. This can have a big impact on your financial plan. You should check in with your financial advisor if you have one — or find one if you don’t.


  • Rebalance your portfolio: In addition to checking in on your overall financial plan, you should also examine your investment portfolio to see if you might benefit from rebalancing your portfolio. This is especially true in 2022; the market has been extremely volatile, and you may need to take a look at your asset allocation. Switch money from stocks to bonds or vice versa if needed. This is also a good time to think about if there are any investments, you’re ready to move on from – or if there is a new investment you want to consider making.


  • Think about taxes and tax-loss harvesting: Taxes aren’t due until April, but that doesn’t mean you can’t start thinking about your tax bill right now. One specific way you can address taxes right now is tax-loss harvesting. Tax-loss harvesting is a process by which you can reduce your tax bill by selling securities at a loss. It is very important that you get this process right, as there are a lot of rules and regulations you’ll have to follow, so it makes sense to work with a financial advisor on this one.


  • Assess your charitable giving: Giving to charity is a good idea for a variety of reasons. First off, it makes you feel good, and it does good for others. While those are obviously good enough reasons to give to charity, the third reason may be what pushes you over the edge: you can get a tax break. Charitable contributions are tax deductible, meaning you can end up owing less once you’ve filed. You have to make the deductions by the end of the year, though, to get the deduction on this year’s taxes, so write those checks and get them in before the new year.


  • Consider your debt: The end of the year is also a good time to check in on your debt. If you got a Christmas bonus, for instance, you could use it to pay down some debt, whether it is outstanding credit card debt or a student loan that needs to be paid down.


  • Make contributions to your retirement plan: You can contribute up to $20,500 to your workplace retirement plan, such as a 401(k) in 2022. If you want to max out your contributions for this year, you’ll need to make sure you make any contributions by the end of the year. If you’ve already maxed out your contributions for this year, the maximum contribution will go up to $22,500 in 2023. You can also make contributions to your individualized retirement plan, up to the limit of $6,000 for 2022. You do have a bit of extra time on this one, though, as you can allocate contributions for this year until Tax Day.


  • Consider Medicare prices: If you’re old enough to be enrolled in Medicare, you need to make sure you know about price changes that will be coming in 2023. This is one where you’ll actually save a bit of money: the standard monthly premium for Medicare Part B will go down from $170.10 to $164.90 in 2023. That isn’t exactly a windfall, but hey, it beats a price hike.


  • Look at your Social Security increase: Social Security, on the other hand, is going up, and in a big way. Due to record inflation in the past year, the increase will be 8.7 percent. Make sure you take that into account when considering your budget for 2023.


  • Review your estate plan: The end of the year is also a great time to review your estate plan. There could be changes you want to make. If you’ve come into money or bought a new house, for instance, you’ll want to adjust your will. You should also check on the beneficiaries for all of your retirement accounts, especially if you’ve gone through a major life event like a wedding, a divorce or the birth of a child.


-Crain’s Detroit Business

Types of Renewable Energy

Renewable energy sources, such as biomass, geothermal resources, sunlight, water, and wind, are natural resources that can be converted into these types of clean, usable energy:


  • Bioenergy
  • Geothermal Energy
  • Hydrogen
  • Hydropower
  • Marine Energy
  • Solar Energy
  • Wind Energy

Benefits of Renewable Energy

The advantages of renewable energy are numerous and affect the economy, environment, national security, and human health. Here are some of the benefits of using renewable energy in the United States:

  • Enhanced reliability, security, and resilience of the nation’s power grid
  • Job creation throughout renewable energy industries
  • Reduced carbon emissions and air pollution from energy production
  • Increased U.S. energy independence
  • Increased affordability, as many types of renewable energy are cost-competitive with traditional energy sources
  • Expanded clean energy access for non-grid-connected or remote, coastal, or islanded communities.

Renewable Energy in the United States

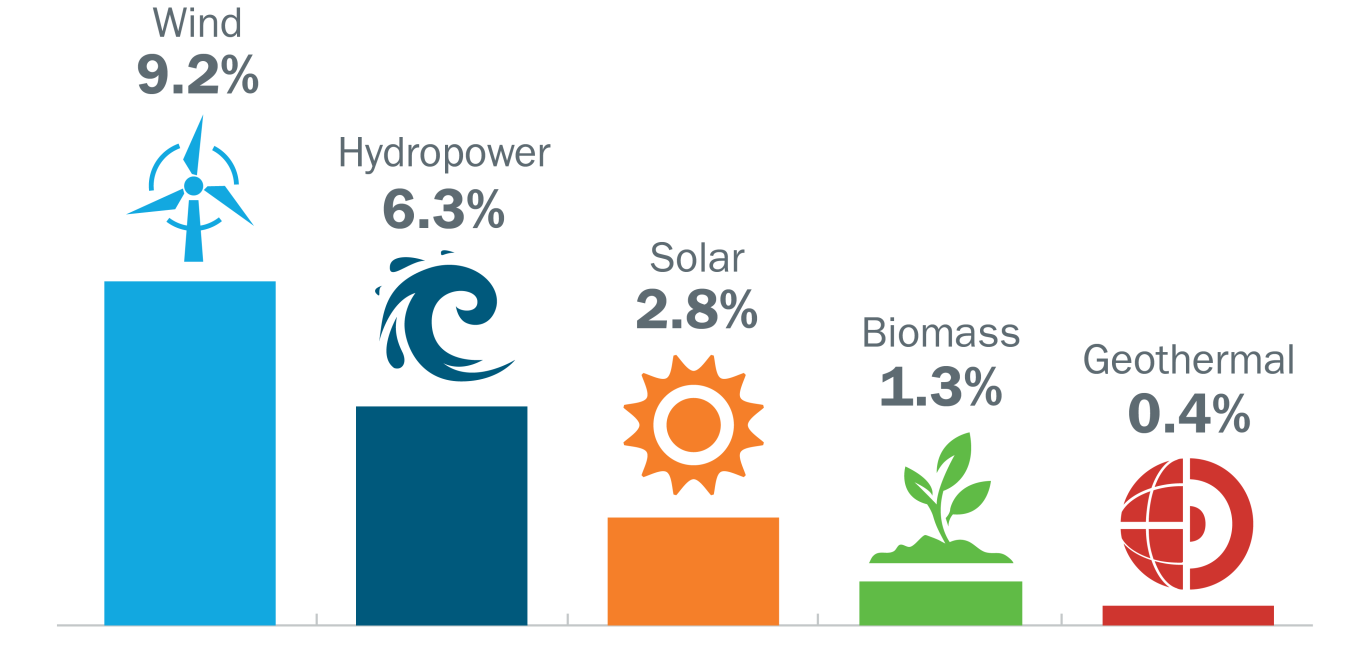
Renewable energy generates about 20% of all U.S. electricity, and that percentage continues to grow. The following graphic breaks down the shares of total electricity production in 2021 among the types of renewable power:

Renewable Energy Share of Total U.S. Electricity Production. 9.2% wind, 6.3% hydropower, 2.8% solar, 1.3% biomass, 0.4% geothermal.

In 2022, solar and wind are expected to add more than 60% of the utility-scale generating capacity to the U.S. power grid (46% from solar, 17% from wind).

The United States is a resource-rich country with abundant renewable energy resources. The amount available is 100 times that of the nation’s annual electricity need. Read more about renewable energy potential in the United States.

*US Department of Energy

Latest Posts