The Noble Institution Blog

In the Noble Institution Blog, you'll find the latest news about the community, tutorials, helpful resources, and much more! React to the news with the emotion stickers and have fun!

Harnessing GovTech to Tax Smarter and Spend Smarter 

Digitalization, done right, can equip governments to improve revenue collection and spending efficiency.

Digitalization is a transformative force as powerful as the advent of the printing press in the 15th century or electricity in the 19th. Yet some governments have been slow to harness the potential of digital technology to improve delivery of public services and strengthen public finance.

A two-pronged policy approach is required—connecting unconnected households to the internet and accelerating and strengthening the adoption of digital solutions in the public sector. We outline strategies for pursuing these policies in a new staff discussion note on government technology, or govtech.

Encouraging digital adoption

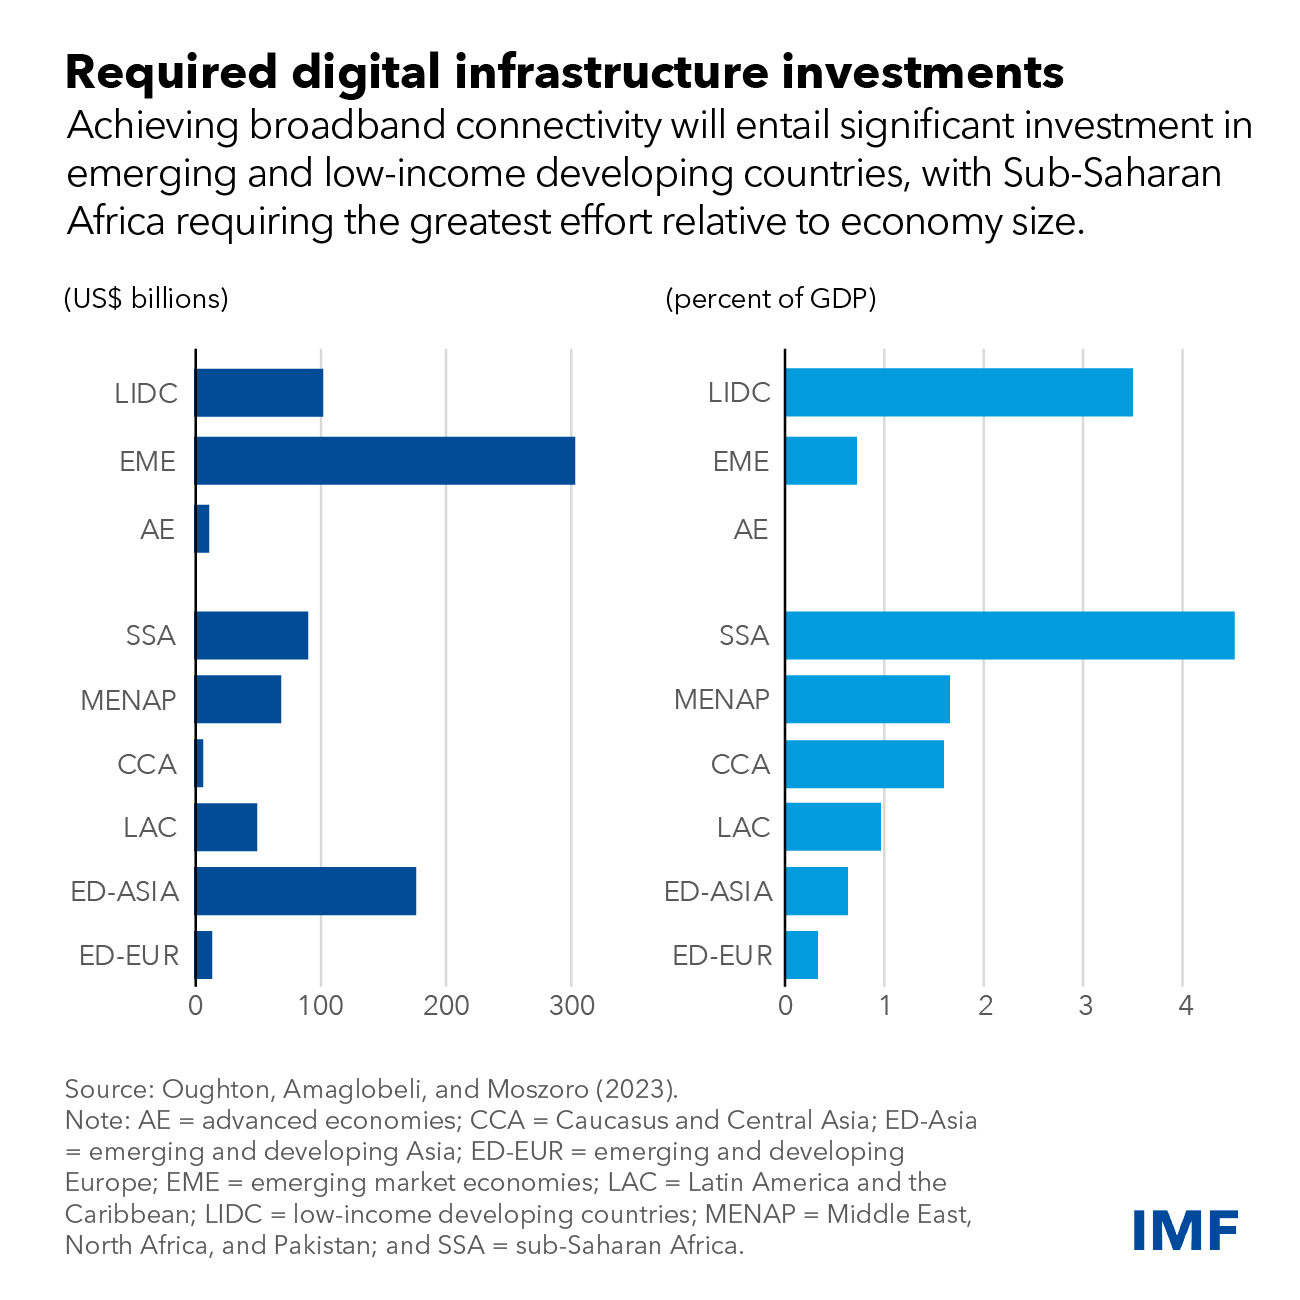
Emerging and developing countries have the most potential to leapfrog their development trajectory by adopting digital technologies. These countries lag considerably behind in internet connectivity, a key enabler for adopting and using digital technologies. Globally, about 2.7 billion people still need to be connected. Within countries, a digital divide persists across age and gender. Bridging this divide and benefiting from digitalization takes adequate digital infrastructure.

Our estimates show that $418 billion of investment in digital infrastructure is needed to connect unconnected households. The bulk of these investment needs are in emerging market and low-income developing economies, with the latter’s requirements estimated at 3.5 percent of GDP. Government support can be crucial in achieving universal connectivity by incentivizing or directly investing in building internet infrastructure, especially in regions where profitability remains challenging.

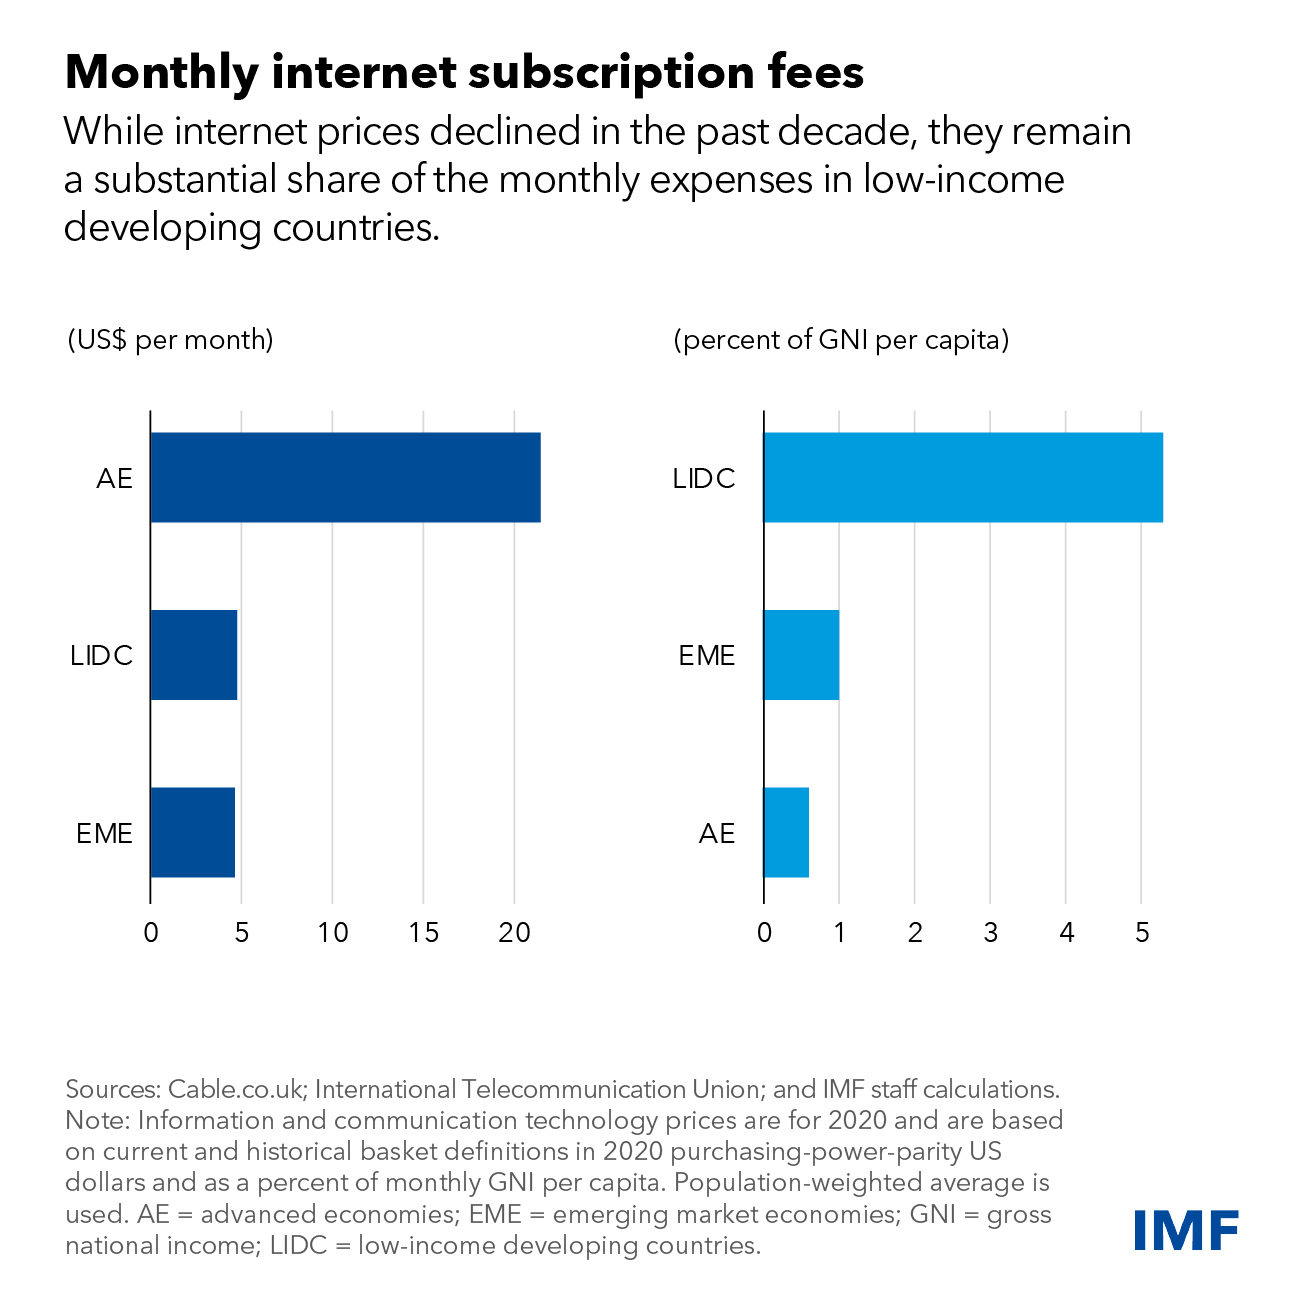
In addition to infrastructure, affordability and digital literacy are crucial. Internet subscription costs remain high in low-income developing countries, where, relative to average incomes, the average cost is nine times the amount citizens in advanced economies spend. To make internet access more affordable, governments can consider offering discounts or vouchers on subscription fees. Additionally, promoting digital literacy programs is essential to overcome reluctance among specific populations, particularly older individuals, to embrace new digital technologies.

The Power of govtech:

Digitalization enables governments to leverage technology to enhance revenue collection, improve efficiency of public spending, strengthen fiscal transparency and accountability, and improve education, health-service delivery, and social outcomes. These can be achieved through better decision-making processes, adoption of international standards and practices, transformation of public financial management processes and systems, and improved taxpayer and trader services to support voluntary compliance and trade facilitation.

Adopting govtech in fiscal operations can strengthen public finance on both revenue and spending sides. IMF staff analysis shows that e-filing, e-invoicing and electronic fiscal devices could lead to a significant increase in tax revenues. For example, the adoption of e-invoicing and electronic fiscal devices could improve revenue mobilization by up to 0.7 percent of GDP. Digitalization’s impact on revenue administration is enhanced by expanding digital connectivity and ensuring sufficient staffing and expertise among tax officials. Similarly, the automation of budget payments using digital technologies is associated with more budget transparency. Our analysis suggests that digitalization is generally associated with an improvement in the efficiency of expenditure.

Digitalization can also improve the effectiveness of social spending and the quality of public service delivery. Digital interventions, such as providing students with equipment and software, can improve education outcomes. In healthcare, govtech can help improve quality of care, increase the coverage of underserved populations, and optimize resource utilization. Electronic health records, telemedicine, and digital platforms for patent licensing, procuring medicine, and monitoring infectious diseases are areas of digital innovation in health care.

Digitalization can also help strengthen social safety nets through better identification, verification of eligibility, and provision of delivery mechanisms. For example, integrating digital ID and creating extensive socio-economic data can enable governments to better target and accurately verify beneficiaries receiving social assistance.

But these benefits from digitalization can materialize only if it is done right. Implementing large digitalization programs is a complex undertaking and requires careful planning, adequate resources, political support, and appropriate change management processes. Digitalization may require changes in regulations and established processes, adequate staffing and expertise among officials, and strong safeguards for data security and privacy to protect sensitive information. Without adequate safeguards, implementing complex digital solutions could even be counterproductive and facilitate corruption.

By adopting an approach to digitalization where citizens’ needs are the primary focus and engaging in close collaboration with stakeholders, govtech can help overcome these challenges and unlock its full potential to enhance public services for society. The IMF stands ready to support countries through its capacity development in implementing govtech solutions for public finance.

Energy Storage Important to Creating Affordable, Reliable, Deeply-Decarbonized Electricity Systems

MIT Energy Initiative report supports energy storage paired with renewable energy to achieve decarbonized electricity systems

TOM MELVILLE       ·    MITEI

In deeply decarbonized energy systems utilizing high penetrations of variable renewable energy (VRE), energy storage is needed to keep the lights on and the electricity flowing when the sun isn’t shining, and the wind isn’t blowing—when generation from these VRE resources is low or demand is high. The MIT Energy Initiative’s Future of Energy Storage study makes clear the need for energy storage and explores pathways using VRE resources and storage to reach decarbonized electricity systems efficiently by 2050.

The Future of Energy Storage, a new multidisciplinary report from the MIT Energy Initiative (MITEI), urges government investment in sophisticated analytical tools for planning, operation, and regulation of electricity systems in order to deploy and use storage efficiently. Because storage technologies will have the ability to substitute for or complement essentially all other elements of a power system, including generation, transmission, and demand response, these tools will be critical to electricity system designers, operators, and regulators in the future. The study also recommends additional support for complementary staffing and upskilling programs at regulatory agencies at the state and federal levels.

The MITEI report shows that energy storage makes deep decarbonization of reliable electric power systems affordable. “Fossil fuel power plant operators have traditionally responded to demand for electricity—in any given moment—by adjusting the supply of electricity flowing into the grid,” says MITEI Director Robert Armstrong, the Chevron Professor of Chemical Engineering and chair of the Future of Energy Storage study. “But VRE resources such as wind and solar depend on daily and seasonal variations as well as weather fluctuations; they aren’t always available to be dispatched to follow electricity demand. Our study finds that energy storage can help VRE-dominated electricity systems balance electricity supply and demand while maintaining reliability in a cost-effective manner—that in turn can support the electrification of many end-use activities beyond the electricity sector.”

The three-year study is designed to help government, industry, and academia chart a path to developing and deploying electrical energy storage technologies as a way of encouraging electrification and decarbonization throughout the economy, while avoiding excessive or inequitable burdens.

Focusing on three distinct regions of the United States, the study shows the need for a varied approach to energy storage and electricity system design in different parts of the country. Using modeling tools to look out to 2050, the study team also focuses beyond the United States, to emerging market and developing economy (EMDE) countries, particularly as represented by India. The findings highlight the powerful role storage can play in EMDE nations. These countries are expected to see massive growth in electricity demand over the next 30 years, due to rapid overall economic expansion and to increasing adoption of electricity-consuming technologies such as air conditioning. In particular, the study calls attention to the pivotal role battery storage can play in decarbonizing grids in EMDE countries that lack access to low-cost gas and currently rely on coal generation.

The authors find that investment in VRE combined with storage is favored over new coal generation over the medium and long term in India, although existing coal plants may linger unless forced out by policy measures such as carbon pricing.

“Developing countries are a crucial part of the global decarbonization challenge,” says Robert Stoner, the deputy director for science and technology at MITEI and one of the report authors. “Our study shows how they can take advantage of the declining costs of renewables and storage in the coming decades to become climate leaders without sacrificing economic development and modernization.”

The study examines four kinds of storage technologies: electrochemical, thermal, chemical, and mechanical. Some of these technologies, such as lithium-ion batteries, pumped storage hydro, and some thermal storage options, are proven and available for commercial deployment. The report recommends that the government focus R&D efforts on other storage technologies, which will require further development to be available by 2050 or sooner—among them, projects to advance alternative electrochemical storage technologies that rely on earth-abundant materials. The report suggests government incentives and mechanisms that reward success but don’t interfere with project management. The report also calls for the federal government to change some of the rules governing technology demonstration projects to enable more projects on storage. Policies that require cost-sharing in exchange for intellectual property rights, the report argues, discourage the dissemination of knowledge. The report advocates for federal requirements for demonstration projects that share information with other U.S. entities.

The report says many existing power plants that are being shut down can be converted to useful energy storage facilities by replacing their fossil fuel boilers with thermal storage and new steam generators. This retrofit can be done using commercially available technologies and may be attractive to plant owners and communities—using assets that would otherwise be abandoned as electricity systems decarbonize.

The study also looks at hydrogen and concludes that its use for storage will likely depend on the extent to which hydrogen is used in the overall economy. That broad use of hydrogen, the report says, will be driven by future costs of hydrogen production, transportation, and storage—and by the pace of innovation in hydrogen end-use applications.

The MITEI study predicts the distribution of hourly wholesale prices, or the hourly marginal value of energy will change in deeply decarbonized power systems—with many more hours of very low prices and more hours of high prices compared to today’s wholesale markets. So, the report recommends systems adopt retail pricing and retail load management options that reward all consumers for shifting electricity use away from times when high wholesale prices indicate scarcity, to times when low wholesale prices signal abundance.

The Future of Energy Storage study is the ninth in MITEI’s “Future of” series, exploring complex and vital issues involving energy and the environment. Previous studies have focused on nuclear power, solar energy, natural gas, geothermal energy, and coal (with capture and sequestration of carbon dioxide emissions), as well as on systems such as the U.S. electric power grid.


EM Rate Cuts on the Horizon as Inflation Trends Down

EMERGING MARKETS
August 8, 2023
Brazil’s central bank kicked off a monetary easing cycle on August 2, 2023, more aggressively than expected, reducing its benchmark interest rate by 50 basis points to 13.25% and signaling more of the same in the months ahead due to an improving inflation outlook. It is the third central bank in emerging markets (EM) to cut rates in recent months, preceded by Chile in July and Hungary, which was the first to cut rates in May of this year.
When runaway inflation first began sweeping across the globe, emerging markets central banks were generally ahead of the curve, raising rates much more quickly than their developed market counterparts. For example, Brazil began its monetary tightening cycle in March 2021, ahead of most others, and raised the Selic (the Brazilian federal funds rate) to a six-year high of 13.75% by August 2022. Now that inflation is seemingly coming under control in many markets, it appears that EMs could also be earlier in cutting rates.
The pace of the monetary easing cycle may not be as rapid and will vary by country. After a significant decline in EM headline inflation in the first half of the year, we expect a more visible reduction in core inflation in the second half. A backdrop of slow and steady rate cuts combined with reasonable growth in many EM countries should be positive for local currency debt. More stable market dynamics could likewise benefit select hard currency (U.S. dollar-denominated) sovereign and EM corporate issuers.
EM inflation should continue to slow in the second half of the Year
Emerging markets have historically struggled with inflation and last year was no exception. Higher commodity prices resulting from the Russia/Ukraine conflict (EM countries tend to be more sensitive to commodity prices given the generally higher weight of food and energy in inflation baskets), supply chain issues and weak EM currencies fed inflationary pressures.
This year, the surge in food and energy prices has abated, supply chain bottlenecks have eased, and the U.S. dollar has plateaued or weakened against many currencies. As a result, inflation has slowed both on a month-on-month and year-on-year basis in most EM economies.
Moreover, after surprising to the upside for the past couple of years, inflation surprises have generally now turned negative. This disinflation trend looks set to continue in the second half of the year.
That said, there remains a great deal of regional variation. Inflation is relatively contained in Asia. Whereas in Central/Eastern Europe and Latin America, not only has food inflation been persistent, but there has also been a broadening of price pressures to both core goods and services. Part of this has been due to rising inflation expectations, leading to higher wages. This suggests that inflation may remain above central bank targets/comfort zones for longer than previously thought in both regions, even though it has likely peaked and should trend lower.
Other EM central banks need a few more Catalysts
Given the general improvement in the inflation outlook, we (the EM debt team) expect a number of EM central banks to start cutting interest rates along the lines of Brazil, Chile and Hungary. Many EM central banks are ahead of the developed world in their monetary tightening cycle, having raised interest rates earlier and more aggressively to avoid de-anchoring inflation expectations. Turkey has been the main exception, with its policy of reducing interest rates despite high inflation, although it has now started to reverse this unorthodox policy following recent elections, almost doubling interest rates in June.
But while we believe the easing cycle is imminent, many EM central banks will only take this step when there is more certainty that inflation is on the decline, especially core inflation.

Many EM central banks aggressively hiked policy rates


Chart shows the change in policy rates from 31 December 2020 to 3 August 2023 for Hungary (12.4%), Colombia (11.5%), Brazil (11.25%), Chile (9.75%), Peru (7.5%), Mexico (7%), Czech Republic (6.75%), Poland (6.65%), Romania (5.5%), South Africa (4.75%), Philippines (3.75%), South Korea (3%), India (2.5%), Indonesia (2%), Thailand (1.75%), Malaysia (1.25%), Turkey (0.5%) and China (-0.3%).


Source: Bloomberg. Data as of August 3, 2023.

Looking ahead, the actions of the U.S. Federal Reserve (Fed) and the real interest rate differential between EM countries and the U.S. will be important factors. While it’s not yet clear whether the Fed is at the end of its hiking cycle or still has further to go, we’re unlikely to see the sharp upward pricing in U.S. rates that we have seen over the past year.

Countries across Latin America have been more aggressive in tackling inflation


Chart shows core inflation and the central bank policy rate, respectively, for Latin America (Brazil: 7.25%, 13.25%; Mexico: 7.39%, 11.25%; Chile: 7.9%,10.25%; Colombia: 11.59%, 13.25%; Peru 5.11%, 7.75%), Eastern Europe (Czech Republic: 11.4%, 7%; Hungary: 22.8%, 13%; Poland: 11.5%, 6.75%; Romania: 8.7%, 7%) and Asia (Indonesia: 2.66%, 5.75%; Malaysia: 3.6%, 3%; China 0.6%, 3.55%; Thailand 1.55%, 2.25%).


Source: Bloomberg. Inflation rate as of April 2023 for Romania and Malaysia and as of May 2023 for other regions. Policy rate as of August 3, 2023.

Finally, the U.S. dollar will be important to watch as it will be difficult for EM central banks to cut rates in a strong dollar/weak EM currency environment. A strong dollar has often forced EM central banks to raise rates in the past, while a weaker dollar has allowed them to cut rates. U.S. dollar cycles (since the abolition of the Bretton Woods system in the early 1970s) have generally moved in clear bull and bear phases, with the average cycle lasting around nine years. If the most recent cycle ended in the fourth quarter of 2022, then it lasted 11 years from the low in June 2011. Aside from the fact that the U.S. dollar is overvalued on almost all valuation metrics, several factors support the case for a weaker dollar, including the Fed coming to the end of its rate hiking cycle. Although it is not clear that the bull market for the U.S. dollar has turned, the bulk of the broad dollar strengthening is likely behind us.

EM exchange rates could start to contribute to returns
EM exchange rates have been a drag on local currency asset returns over the past decade, but today most EM currencies look significantly undervalued based on our in-house fundamental-based valuation model, along with various other real exchange rate models.
While cheap valuations are never enough of a catalyst in-and-of themselves, the fundamental outlook of many emerging markets looks constructive, which could help support a turnaround in EM currencies versus the dollar. Inflation and cost of living concerns have put pressure on fiscal deficits, which have steadily risen over the last few years. That said, public debt levels are still below those of developed markets and remain manageable. There has been some erosion of foreign exchange reserves, but external balances have generally improved across many EM countries thanks to undervalued exchange rates.
We see the most value in Latin America, but Europe is looking increasingly attractive
A downward trend in policy rates, combined with decent overall fundamentals and relatively attractive nominal rates and positive real rates across much of the EM universe, indicate a reasonably constructive view of EM debt overall. This explains why, after over a decade of relatively muted returns, stronger performance of the asset class (as represented by the J.P. Morgan Emerging Market Bond Index (EMBI) Global Diversified and the J.P. Morgan Government Bond Index – Emerging Markets Global Diversified) so far this year could turn into a longer-term trend.
That said, selectivity will be key given the divergence in policy and inflation dynamics across countries, as well as varying relative and absolute valuations across issuers. We see potential value in Latin American local currency bonds given the combination of attractive nominal and positive real rates, moderating inflation and proactive behavior on the part of central banks. Macroeconomic conditions are looking better now than late last year and the tilt towards more positive fundamentals is likely to override political risks in those countries for now. Central and Eastern European countries are still struggling to curb inflation — and real rates remain negative — but the region is beginning to look more attractive.
Opportunities in dollar-denominated debt are more select and Idiosyncratic
Opportunities within the U.S. dollar-denominated sovereign universe tend to be more idiosyncratic. In the higher yielding, lower quality credits, we find the debt of distressed and quasi-distressed issuers to be attractive in cases where many of the challenges they face have already been priced in. Debt restructurings across this segment of the market tend to be more frequent but are likely to be limited to the most vulnerable economies. 
Across the investment-grade (BBB/Baa and above) sovereign bonds space, valuations are less attractive. Nevertheless, the EM debt team sees value in select lower beta credits as a counterbalance to the high-yield positions held in certain portfolios.
Several EM corporate bonds appear reasonably cheap. We favor investing in a variety of these credits across eligible portfolios for both their relative value compared to similarly rated sovereign bonds and the potential diversification benefits they provide.


Real yields look attractive across some countries in Latin America


Chart shows real yields (represented by 5-year yields minus core inflation) for South Africa (6.1%), Dominican Republic (5.1%), Brazil (3.6%), Indonesia (3.6%), Uruguay (2.6%), China (2.1%), Peru (1.6%), Mexico (1.6%), Thailand (1.1%), Philippines (1%), Malaysia (0.3%), Colombia (-1%), Romania (-2%), Chile (-2.4%), Czech Republic (-3.4%), Poland (-5%), Hungary (-12.1%).

Source: Bloomberg. Data as of June 20, 2023. Real yields are represented by 5-year yields minus core inflation. *Real yield for Hungary is -12.1%.

Bottom line

As inflation slows across a number of emerging markets, central banks are likely to pivot toward rate cuts in the coming months and quarters. With fiscal and current account profiles looking largely benign or manageable for many of these economies, this anticipated shift in monetary policy alongside reasonably attractive valuations and fundamentals could lead to longer term gains for many credits across the asset class.
Capital Group
Kirstie Spence Fixed/ Income Portfolio Manager
Harry Phinney/Fixed Income Investment Director

How Governments Can Drive a Faster, Bigger and Better Energy Transition

A holistic approach to policy-making by governments is required to bring out the energy transition.
What’s the World Economic Forum doing to accelerate action on Climate Change?
  • The energy transition must be backed by a strong and holistic approach to policy-making by governments.
  • The key to this lies in more specific nationally determined contributions – and the year of COP26 is the year to do it.

The very first automobiles, introduced in the 1880s, were expensive, niche, and used only by the rich. Within 30 years, Ford’s Model T entered mass production. This pushed the number of car-owning households in the US from 8% in 1918 to 60% by 1928, and triggered the spread of electrification, suburbs, cinemas, shopping centers, sophisticated advertising and much more.

That’s not linear growth – it’s exponential. We’ve seen it happen time and again throughout history, whether from horses to cars or valves to transistors, and each time it has fundamentally changed the way we live and operate. Our race to a zero-carbon energy system will be no different.

But in the same way that pro-business policies spurred the American economic boom and innovation like the Model T in the 1920s (which, incidentally, followed the Spanish flu pandemic), the clean energy transition must be backed by holistic government policy.

Key to this is achieving greater specificity in countries’ nationally determined contributions (NDCs) under the Paris Agreement – setting out how and when each sector will reach zero emissions and involving all economic actors and government ministries. The benefits of decarbonizing energy extend well beyond individual sectors to health, jobs, education, equality and nature conservation. But the work behind it does too.

This is the year to do it, ahead of November’s COP26 climate summit in Glasgow, where all countries must raise their NDCs. As a first step, governments must rally their ministers of energy, climate, transport, health and other portfolios around the same goal: zero-carbon energy. Ministers can then align their policies with the NDC targets and begin to implement them.

Energy Transition Statistics

The energy sector is already leading the charge to zero emissions, with breakthroughs and rapid price declines across the auto, power and lighting sectors. Globally, the number of electric vehicles on the road has jumped from 17,000 in 2010 to more than 7.2 million today. The installation of solar power grew from 290 MW in 2001 to nearly 127,000 MW in 2020. The share of LED bulbs in the lighting market has grown from 1% in 2010 to an expected 69% in 2020 and will be nearly 100% by 2025.

The growth is happening even where governments lag behind. But it’s faster if led by policy. China has 420,000 electric buses on the road, driven by Beijing’s war on air pollution. Norway last year became the first country to sell more electric vehicles than petrol, diesel and hybrid, backed by Oslo’s target to end internal combustion engine sales in 2025.

Major economies' emissions since 1990, with energy transition roadmaps to NDCs and net-zero

Major economies’ emissions since 1990, with energy transition roadmaps to NDCs and net-zero Image: Carbon Brief / Climate Watch

All of Society Transformation

These advancements drive all-of-society transformation. They create well-paying jobsprevent premature deaths through reduced air pollution and introduce affordable energy to rural areas, allowing people to refrigerate produce or medication and enabling children to study by light after sunset.

But reaching the necessary pace and scale requires what UN Secretary-General António Guterres has called “inclusive, networked multilateralism”. The more ambition political leaders demand, the more businesses, investors, cities and regions are challenged to advance. The farther they go, the higher governments can push their targets, and so forth. It’s an ambition loop. Platforms like the Marrakech Partnership’s Climate Action Pathways, the Mission Possible Partnership and the Race to Zero Breakthroughs are enabling this kind of pre-competitive collaboration, reducing the risk of the energy transition.

The energy transition is gaining momentum even in the midst of the COVID-19 health and economic crisis, with high-emitting countries setting net-zero emissions goals: China by 2060, the EU, US, Canada, South Korea, Japan and South Africa by 2050.

The UK’s new NDC is rooted in the plan for a green industrial revolution that will create 250,000 British jobs this decade. In 2030, London intends to have ended the sale of petrol and diesel cars, reached 5 GW of green hydrogen production capacity and quadrupled offshore wind capacity, among other plans.

South Africa’s new goal for net zero by 2050 is backed by a strategy to cut coal-fired power supply from around 90% now to 46% by 2030 and 30% by 2050, while boosting wind, solar and hydro. This falls short of the Paris goals, but the ambition – set against a serious economic battering from high COVID-19 rates – is laudable.

Yet the bigger signs of energy transformation are coming from the private sector. International Airlines Group and Oneworld Alliance are ahead of the International Civil Aviation Organization in setting net-zero targets. General Motors is aiming for net zero by 2040 and calling on the US government to forge a national zero-emissions vehicle program. Nestlé intends to halve its emissions by 2030 by supporting the shift to regenerative agriculture and planting hundreds of millions of trees.

Impact of Policy Making on Energy Transition

Government policy will help to both realize these ambitions and continuously ramp them up at the scale demanded by the Paris agreement. NDCs could drive decarbonization by ending fossil fuel subsidies and pricing carbon, shifting investments from fossil fuels to renewables, ending the sale of petrol and diesel vehicles, and ending deforestation – as the NDC Partnership recommends. And as the Coalition for Urban Transitions states, investing in cities – including low-carbon buildings and mobility, renewable power and green spaces – would also enhance both national COVID-19 recoveries and Paris contributions.

Of course, all these policies must uphold two pillars in the race to a healthy, resilient zero-emissions world: the just transition and nature regeneration.

We know the energy transition will create jobs, but those jobs must be made available in places where workers and communities rely on fossil fuels. The just transition is a local challenge, and political and business leaders should treat it as such.

What’s the World Economic Forum doing about the transition to clean energy?

The world we live in today has been shaped by the breakthroughs of our past – from the Model T assembly line to the spread of mobile phones across previously unconnected rural areas. Such breakthroughs continue to propel us towards a safer future, as long as governments make sure the whole of society comes along for the ride.

License and Republishing

World Economic Forum articles may be republished in accordance with the Creative Commons Attribution-NonCommercial-NoDerivatives 4.0 International Public License, and in accordance with our Terms of Use.

The views expressed in this article are those of the author alone and not the World Economic Forum.

New Reality for Investors: 5 Big Trends Changing Markets

There’s a new reality taking shape in global markets.
Commentators have in the last few months mostly focused on a rotation from growth to value, but I think that view is too simplistic. I see many shifts happening simultaneously that could likely define the next decade in markets around the world.
Many investors are expecting a return to normal after inflation subsides and central banks stop raising rates. But I believe the world is undergoing significant changes and that investors will need to reset their expectations about how a typical investing environment will look. Here are five seismic shifts happening in economies and markets right now, as well as the long-term investment implications of each:

1. From falling rates to rising rates and higher inflation

The market is grappling with a macro environment it hasn’t seen in a long time. Inflation is its highest since the early 1980s. And until recently we’ve had 40 years of declining interest rates. That’s longer than most investment managers’ careers, if not lifetimes. That’s part of the reason we see a market struggling to adjust to this new reality.

Is this the end of a 40-year disinflation cycle?


The chart shows U.S. 10-year Treasury yields since 1955. Yields increased from around 3% in 1955 for 26 years to a peak around 15%. For the next 39 years they declined before reaching a trough in 2020.


Sources: Capital Group, Refinitiv Datastream. As of 10/26/22.


It’s easy to assume these are market dislocations that will quickly reverse — bond markets are currently pricing a return to 2% inflation within two years, for example. But these cycles often last much longer than people anticipate, and there is reason to believe higher inflation is structural and likely to persist.

In this new environment I’m especially cautious of highly levered companies, or those raising new debt. Money isn’t “free” anymore, so a larger slice of earnings will go to service debt. Companies with the ability to fund their own growth as well as those with strong pricing power and dependable cash flows will remain attractive in a high-inflation, higher-cost-of-capital world.
2. From narrow to broader market leadership
I think we’re going to be in a much less narrowly concentrated market going forward. The last decade was dominated by a handful of tech stocks that you basically had to own to keep up with the market. I don’t think that’s going to be the case anymore.
I expect opportunities to arise from a variety of companies, industries and geographies. Well-managed companies beyond the tech sector may have their chance to shine again.
For example, e-commerce companies have gone from being the disruptors to being challenged themselves. They’re often very low margin and expensive to scale with difficult delivery logistics to manage. Very few have done it well. Some traditional retailers that have combined the benefits of brick-and-mortar stores with a compelling online shopping experience are starting to take share from pure e-commerce companies.

Market leaders are becoming less concentrated


The line chart shows the ratio of the S&P 500 Equal-Weighted Index to the S&P 500 Index. An upward line indicates market breadth increasing while a declining line indicates market breadth decreasing. From 2015 through 2021, market breadth declined. From 2021 until present market breadth increased, reaching 109.


Sources: Capital Group, Refinitiv Datastream, Standard & Poor’s. As of September 30, 2022. Indexed to 100 as of 1/1/05.


After the market’s dive in 2020, I expected leadership to broaden, and it has done so. In my view, this is a healthy development and supports why I have been trying to de-concentrate my own portfolios. In theory, it should be a positive backdrop for stock pickers over indexers.

3. From digital to physical assets
The last bull market was dominated by tech companies that made their fortunes on digital assets, such as online marketplaces, streaming platforms, search engines and social media. This overshadowed the fact that you can’t build a new economy without older industries. Not that digital-first companies are going away, but I think investors will start to place greater emphasis on commodities and producers of physical assets.


Capital spending super cycle could power a new industrial renaissance


The stacked area chart shows capital expenditures across MSCI ACWI sectors on an annual basis from 2007 to 2021. The sectors measured and total capital expenditures in USD billions of each respective sector as of December 31, 2021, are as follows: financials and real estate (66.2), health care (90.0), consumer staples (105.0), materials (177.9), industrials (184.8), energy (225.0), consumer discretionary (238.2), info tech (239.7), communication services (243.7), utilities (252.2).


Sources: Capital Group, FactSet, MSCI. In current U.S. dollars. As of December 31, 2021.


Some might assume that trends like the shift to renewable energy will squeeze out incumbents in traditional sectors like industrials, materials or energy. On the contrary, there may be winners among businesses that are helping other companies be more energy efficient — whether that’s smart buildings, power management or HVAC systems that reduce gas emissions. Other global trends such as grid modernization, reshoring and energy security may cause a boom in capital investment across industries. These are areas where smartly managed industrial companies might have a real renaissance.

4. From multiple expansion to earnings growth
Many newer investors got comfortable with stocks being very expensive over the last five to 10 years and now assume stocks will return to those levels during the next bull market. When rates were near zero the market could support loftier multiples, but I think those days are over.
An exercise I’m trying to apply when evaluating my portfolio is to ask: “What if stocks don’t return to 25x earnings in 2027? What if they only trade at 15x earnings?” If I can make a stock work at that level, then I can probably limit my downside. Using that lens, I’m trying to find emerging and growth-oriented companies that are not valued as such. I like those that may also offer potential upside to the valuation, but where the investment thesis doesn’t depend on it.
If multiple expansion is limited in the next bull market, stock returns will have to be powered by earnings growth. That means markets aren’t likely to be as patient with unprofitable companies. Stocks whose business models depend on cheap money are going away. Companies that funded losses while trying to scale rapidly even where the economics didn’t work are going away. Markets once paid up heavily for future growth, but now with higher interest rates they are less willing to do so. The market is calling time on business models that don’t work when money is no longer free.
5. From global supply chains to regional supply chains
The globalization of supply chains is another multi-decade trend that is shifting. For a generation, companies moved manufacturing to foreign soil to cut costs and boost margins. But the limitations of placing efficiency over resilience are now clear. Rising geopolitical tension and pandemic-induced disruptions have led companies to consider bringing supply chains closer to home.
While bottlenecks caused by COVID shutdowns have improved, many companies are still being impacted. The auto industry is a prime example. Major automakers have tens of thousands of unfinished cars waiting for final parts, and that missing component is often as minor as an inexpensive semiconductor chip. Now companies are creating supply chain redundancies so that a single disruption doesn’t derail their entire operation.
Even as pandemic-related issues ease, I believe increased geopolitical conflicts are here to stay and will continue to fuel this change. The current environment reminds me of the 1970s, with tension between Russia and the West, more aggressive confrontations with China, the rise of authoritarian leaders around the world and less global cooperation. Since the fall of the Berlin Wall, we’ve had more than 30 generally peaceful and prosperous years. But there are more risks now, and this backdrop suggests lower valuations are warranted and “surprises” should feel less surprising.

Higher global tensions have increased risk of relying on international supply chains


The line chart shows the index levels of the Geopolitical Risk Index from 1986 through September 2022. The current level of 152 is the highest during this time period besides immediately after the Persian Gulf War (179) and September 11 attacks (229).


Sources: Capital Group; Caldara, Dario and Matteo Iacoviello (2022), “Measuring Geopolitical Risk,” American Economic Review, April, 112(4), pp.1194-1225. The Geopolitical Risk Index is a measure of adverse geopolitical events and associated risks based upon the tally of newspaper articles covering geopolitical tensions, using a sample of 10 newspapers going back to 1985. Index level values reflect a 12-month smoothed average of monthly data. As of September 2022.

Consider Taiwan Semiconductor Manufacturing Company (TSMC), the world’s dominant manufacturer of cutting-edge semiconductors. After having concentrated the bulk of its capacity in Taiwan — a focal point of geopolitical concerns — the company is building its first manufacturing hub in the United States. It’s also constructing a new plant in Japan. That regionalization should create a more efficient supply chain for some of its top U.S.-based clients, including automakers and technology companies like Apple, Qualcomm and Broadcom.

A flexible investment approach can help weather the storm
The combination of low rates and rising markets made the last 10 years feel like one long sunny day at the beach. While some rain showers have now driven beachgoers indoors, they’re still looking out the window waiting for the storm to pass. They don’t realize that there’s a new weather system upon us with more clouds, colder temperatures and much stronger winds. The world’s not ending, but it may be a wetter, cloudier and colder place — and life won’t be a day at the beach.

Flexible funds can pivot between sectors as market conditions shift


The stacked bar chart shows net change in portfolio weight since 2019 for New Perspective Fund for each equity sector. The consumer discretionary and information technology sectors saw the biggest decreases during this time period. Industrials and health care realized the largest increases.

That may sound like a dark outlook, but I actually see this as a really exciting time to be an investor. As a portfolio manager for New Perspective Fund®, which is not restricted by geographies, sectors or style boxes, my fellow managers and I are able to adjust to this new reality of investing in a variety of ways.

The chart above shows that flexibility in action. Although we didn’t get everything right, we have been shifting from higher growth sectors like consumer discretionary and information technology to health care and industrials over the past few years in anticipation of this new reality. New market environments present new opportunities, and that’s where experience and flexibility can be essential.
Jody Jonsson

Equity Portfolio Manager
Capital Group

Renewable power on course to shatter more records as countries around the world speed up deployment

Global additions of renewable power capacity are expected to jump by a third this year as growing policy momentum, higher fossil fuel prices and energy security concerns drive strong deployment of solar PV and wind power, according to the latest update from the International Energy Agency.

The growth is set to continue next year with the world’s total renewable electricity capacity rising to 4 500 gigawatts (GW), equal to the total power output of China and the United States combined, says the IEA’s new Renewable Energy Market Update, which was published today.

Global renewable capacity additions are set to soar by 107 gigawatts (GW), the largest absolute increase ever, to more than 440 GW in 2023. The dynamic expansion is taking place across the world’s major markets. Renewables are at the forefront of Europe’s response to the energy crisis, accelerating their growth there. New policy measures are also helping drive significant increases in the United States and India over the next two years. China, meanwhile, is consolidating its leading position and is set to account for almost 55% of global additions of renewable power capacity in both 2023 and 2024.

“Solar and wind are leading the rapid expansion of the new global energy economy. This year, the world is set to add a record-breaking amount of renewables to electricity systems – more than the total power capacity of Germany and Spain combined,” said IEA Executive Director Fatih Birol. “The global energy crisis has shown renewables are critical for making energy supplies not just cleaner but also more secure and affordable – and governments are responding with efforts to deploy them faster. But achieving stronger growth means addressing some key challenges. Policies need to adapt to changing market conditions, and we need to upgrade and expand power grids to ensure we can take full advantage of solar and wind’s huge potential.”

Solar PV additions will account for two-thirds of this year’s increase in renewable power capacity and are expected to keep growing in 2024, according to the new report. The expansion of large-scale solar PV plants is being accompanied by the growth of smaller systems. Higher electricity prices are stimulating faster growth of rooftop solar PV, which is empowering consumers to slash their energy bills.

At the same time, manufacturing capacity for all solar PV production segments is expected to more than double to 1 000 GW by 2024, led by China and increasing supply diversification in the United States, India and Europe. Based on those trends, the world will have enough solar PV manufacturing capacity in 2030 to comfortably meet the level of annual demand envisaged in the IEA’s Net Zero Emissions by 2050 Scenario.

Wind power additions are forecast to rebound sharply in 2023 growing by almost 70% year-on-year after a difficult couple of years in which growth was slugging. The faster growth is mainly due to the completion of projects that had been delayed by Covid-19 restrictions in China and by supply chain issues in Europe and the United States. However, further growth in 2024 will depend on whether governments can provide greater policy support to address challenges in terms of permitting and auction design. In contrast to solar PV, wind turbine supply chains are not growing fast enough to match accelerating demand over the medium-term. This is mainly due to rising commodity prices and supply chain challenges, which are reducing the profitability of manufacturers.

The forecast for renewable capacity additions in Europe has been revised upwards by 40% from before Russia’s invasion of Ukraine, which led many countries to boost solar and wind uptake to reduce their reliance on Russian natural gas. The growth is driven by high electricity prices that have made small-scale rooftop solar PV systems more financially attractive and by increased policy support in key European markets, especially in Germany, Italy and the Netherlands.

Newly installed solar PV and wind capacity is estimated to have saved EU electricity consumers EUR 100 billion during 2021-2023 by displacing more expensive fossil fuel generation. Wholesale electricity prices in Europe would have been 8% higher in 2022 without the additional renewable capacity, according to the new IEA report.

While the competitiveness of wind and solar PV has improved since last year, government policies need to adapt to changing market conditions, particularly for renewable energy auctions, which were undersubscribed by a record 16% in 2022. Moreover, policies need to focus on timely planning and investment in grids in order to securely and cost-effectively integrate high shares of variable renewables in power systems. Multiple countries in Europe including Spain, Germany and Ireland will see wind and solar PV’s combined share of their overall annual electricity generation rise above 40% by 2024.

2023 Market Outlook: Cross Currents

Cross currents continue to rock the economic boat, even though we believe a brighter year is on the horizon.

The Federal Reserve’s ongoing commitment to raising interest rates to cool inflation is likely to lead to weak U.S. economic trends in early 2023. However, Fed policymakers have indicated they are looking to an eventual pause in rate hikes, possibly in early to mid-2023, and that it is likely the federal funds rate target will remain at its peak, or “terminal,” rate for a while.1

In other words, there may be more choppiness, given that inflation is still a noticeable (although receding) problem, but the longer-term U.S. economic outlook has improved.

Source: Schwab Center for Financial Research

U.S. stocks and economy: How many more times, Fed?

It wouldn’t surprise to us to learn that a U.S. recession is coming or already in progress. The Conference Board’s Leading Economic Index has had an eight-month change consistent with every recession going back to 1960.

Leading economic indicators are pointing to recession

Chart shows the Conference Board's Leading Economic Index dating back to 1960, with recessionary periods overlaid in gray. The Leading Economic Index has fallen by -3.8% this year, an 8-month change consistent with every recession since 1960.

Source: Charles Schwab, Bloomberg, The Conference Board, as of 10/31/2022.

The Fed is trying to thread the needle between slowing growth enough to curtail inflation while at the same time avoiding a recession—a feat known as achieving a “soft landing”—but that’s a very narrow opening. And frankly, history isn’t on the Fed’s side when it comes to soft landings. We think it is only a matter of time until cracks in the labor market widen and we see a recessionary move up in the unemployment rate. In fact, the Fed is telling us in its own forecast that a recession is expected: The central bank’s latest expectation for 4.4% unemployment in 20232 would be a 0.7% increase from the current rate.

It may seem counterintuitive, but employment weakness would be welcome sooner rather than later, as it would bring the Fed closer to “checking the box” of increasing slack in the labor market—ultimately helping put downward pressure on inflation and allowing the Fed to ease up on the brake it has been applying to the economy. If this occurred alongside a stabilization and/or turn higher in leading indicators, it would set up the economy for better days later in the year.

Global stocks and economy: Risk and recovery

A better year for global investors may lie ahead, but volatility may remain high in early 2023 as a potential global recession lingers, central banks step down rate hikes, and China’s post COVID-19 reopening introduces upside risk to inflation.

Inflation is still stubbornly high. Central banks stepping down the pace of rates hikes is more about responding to weak economies than making strong progress on lowering inflation. Even though third-quarter economic growth was better than expected for many major countries in North America, Europe, and Asia, a global recession likely began sometime during the third quarter.

One important signal of an already-underway recession is the leading indicator for the world economy produced by the Organization for Economic Cooperation and Development. In this index, a drop below 99 tends to happen right around the start of a global recession. It’s a repeating story, and it’s below 99 again, signaling another potential recessionary period.

Global leading indicators point to global recession

Line chart of OECD Global Leading Indicators since 1970, illustrating pattern of recession when the indicators breach the 99 threshold level.
The depth of this potential recession appears to be mild, so far. Some parts of the global economy and some countries are growing, offsetting others that are contracting. For example, while there remains strength in services (seen in travel and leisure), the demand and manufacture of goods has been weakening (evidenced by rising inventories and slowing product sales). The likely recession is rolling through different parts of the global economy at different times, in contrast to the everything-everywhere-all-at-once recessions of 2020 and 2008-09.

China’s authorities are preparing to end the zero-COVID policies that have held back their economy for the past three years. In reaction, the MSCI China Index rose 29% in November, compared to just 5% for the S&P 500 Index. This surge in Chinese stocks has propelled outperformance of emerging-market stocks. Yet—in another example of counterintuitive cross currents—the potential reopening poses upside risk to inflation just as central banks appear to be stepping down their rate hikes. We will be watching developments carefully to assess the balance between the impact of reopening excitement and inflation worries on the stock market.

Fixed income: Bonds are back

It has been a long time coming, but 2023 looks to be the year that bonds will be back in fashion with investors. After years of low yields followed by a brutal drop in prices during 2022, returns in the fixed income markets appear poised to rebound.

Our optimism about returns for 2023 is based on three factors:

  • Starting yields are the highest in years—in both nominal and real terms;
  • The bulk of the Fed tightening cycle is over; and
  • Inflation is likely to decline.

After a long drought, the bond market is awash in yields that are attractive relative to other income investments. A portfolio of high-quality bonds—such as Treasuries and other government-backed bonds, and investment-grade corporate bonds—can yield in the vicinity of 4% to 5% without excessively high duration. Tax-adjusted yields in municipal bonds are also attractive for investors in higher tax brackets. In addition to the relatively attractive yields, higher coupons for newly issued bonds should help dampen volatility.

We expect the Federal Reserve to end its rate hikes in early-to-mid-2023 amid a soft, perhaps recessionary, economy that brings inflation lower. Given that outlook plus the year-end rally in bonds, yields may rebound early in the year. However, the yield curve (the difference between short-term and longer-term Treasury yields) is likely to remain deeply inverted as monetary policy remains tight. Assuming the Fed sticks to its tight policy stance at the expense of economic growth, 10-year Treasury yields could fall as low as 3%. With that backdrop, we favor adding duration to bond portfolios during periods of rising rates, while staying up in credit quality.

Investor takeaway: Focus on quality

We continue to recommend more of a factor-based investment process than a sector- or style-index-based process. At least until the economy begins to stabilize, we suggest that stock-picking-oriented investors focus on quality-based factors, such as balance sheet liquidity, positive earnings revisions, strong free cash flow, and lower volatility.

In global stocks, one way we’ve been defining quality is high-dividend payers—generally a sizeable dividend is a sign of financial strength and good cash flow. High-dividend-paying stocks have outperformed during past recessionary bear markets, and they outperformed again in 2022 across sectors and countries. So did short-duration stocks (that is, stocks of companies with more immediate cash flows, rather than cash flows in the distant future): They outperformed in 2022 both when the market was falling and in the fourth quarter when it rebounded. There can be no guarantees, but investors may be able to navigate 2023 by sticking with what has been working in both up and down markets during 2022.

We’re similarly focused on quality in the fixed income market. Investment-grade bonds are likely to provide attractive yields in 2023 at lower risk than we’ve seen for several years. Current yields on riskier bonds, such as high-yield bonds, don’t provide enough compensation for the extra risk, in our view. Things may change as the year progresses, but for now we recommend staying up in credit quality and increasing duration, keeping the average near your long-term benchmark.

1 The terminal rate is the level of the federal funds rate at which the Federal Reserve is expected to stop raising the rate.

Emerging Markets Outlook 2023

The first half of 2023 will be challenging for emerging markets, but lower inflation and China’s reopening will likely present opportunities for growth in the second half.
The outlook for emerging market economies in 2023 will largely be dictated by inflation. Eastern Europe, Latin America, and much of Africa have faced a more pronounced inflationary cycle over the last year. Higher interest rates amid the spike in cost of living is expected to weaken domestic demand in these regions. However, Middle Eastern and Asian economies are expected to fare better as inflationary pressures have been more benign, and their central banks have been able to keep interest rates relatively low. The war in Ukraine, China ending its zero-tolerance COVID-19 policy, and the growth trajectory for the United States and European Union pose risks to this outlook.

Pandemic-related supply chain disruptions and changes to consumer preferences caused global inflation to surge in 2021. Eastern Europe, Latin America, and parts of Africa experienced some of the worst inflation in 2022 (figure 1). Chile, Brazil, Poland, Czechia, and Nigeria had all started 2022 with core inflation above 7% on a year-ago basis.1 Then came Russia’s invasion of Ukraine in early 2022, which exacerbated inflation further as the supply of food, energy, and other commodities coming from the region was cut off. In addition, the Fed began hiking interest rates, which weakened emerging market currencies. Many emerging market central banks implemented their own rate hikes to prevent further currency depreciation and restrain inflation.

Although central banks in many emerging market countries responded relatively early to inflationary pressures, price growth continued to accelerate over much of 2022. Fortunately, some of those price pressures have eased more recently, particularly in Brazil, Chile, and Czechia.2 As a result, the central banks in these three countries were able to keep rates on hold in Q4 2022.3 Disinflation in Latin America and Eastern Europe has been a welcome development. However, excessive government spending and a flare-up in the Ukraine war or energy markets could easily exacerbate price pressures again. New government administrations in both Chile4 and Brazil5 have large social-spending ambitions that could reverse progress on inflation. In Eastern Europe, the biggest risk stems from the war in Ukraine and the possibility that energy prices will rise again.

By contrast, emerging Asian economies had faced more limited inflationary pressure last year (figure 1). Each of the ASEAN-6 countries, Vietnam, Indonesia, the Philippines, Singapore, Malaysia, and Thailand, had less than 3% core inflation in January 2022.6 Pandemic-related restrictions endured through much of the year, including in China and Japan, limiting demand-side pressures to inflation. More recently, inflation in the region has picked up a little as demand rebounded and supply-side price shocks—such as higher energy bills—fed through to the prices of other goods and services. Even so, core inflation in Asia has continued to run much lower than in other emerging market countries. For example, the Philippines had the fastest core inflation of the ASEAN-6 countries at 5.9% year over year in December.7 Brazil, Chile, Colombia, and Peru all had higher core inflation over the same period. Core inflation throughout eastern Europe was far higher.

Regardless of the timing of accelerating price pressures, consumers across emerging market countries are either slowing or outright cutting the pace of their spending. Inflation-adjusted retail sales in Chile and Czechia consistently fell during the second half of 2022 on a year-ago basis.8 By Q4 2022, real spending had slowed dramatically across a wide set of countries. Spending declined marginally on a year-ago basis in Thailand in October, while it was up just 0.1% in Indonesia for December.9 The slowdown in consumer spending comes despite the government extending support to households. The governments of Hungary, Czechia, the Philippines, Indonesia, Chile, and Brazil have all implemented policies to alleviate the rise in the cost of living.10

Risk of major default remains muted for now.

As interest rates rise, many governments provide additional support to consumers, and domestic and external demand wanes, concerns over government finances have come to the fore. After all, previous episodes of global monetary tightening have ended poorly for emerging markets. Fixed exchange rates and excessive external debt, especially when denominated in foreign currencies, created a raft of defaults during the Latin American debt crisis in the 1980s and the Asian Financial crisis in the 1990s.11 Today, external debt positions have improved in these countries, and most emerging market currencies have been allowed to float. For example, Thailand’s external debt as a share of GDP is less than half what it was in the late 1990s, and the Thai baht has been a floating currency since the Asian Financial crisis in 1997.12

Despite the general improvement in emerging market finances, a handful of smaller emerging market countries have run into fiscal trouble. For example, Sri Lanka and Ghana have already defaulted.13 The stress in these countries shows up clearly in the interest rates of their government bonds and in their exchange rates. Sri Lanka’s 10-year government bond spread against US treasury bonds averaged around 25 percentage points in December. That is up more than 16 percentage points from its 2019 average. In Ghana, things look even worse, with the spread on 10-year government bonds ballooning to 42 percentage points, more than double the spread in 2019.14

Of the larger emerging market economies, few are facing serious stress. Mexico, India, Taiwan, Thailand, and Vietnam have seen credit spreads narrow since 2019. Even in places where credit spreads have widened, the margin has been relatively slim. Chile, the Philippines, and South Africa have seen their spreads widen less than Germany’s over the same period.15 Colombia and Hungary are two exceptions. Spreads with US treasuries in these countries have widened considerably since the pandemic hit. Both countries have struggled to get their inflation under control and are running current account deficits.

Although 2022 posed a serious challenge for emerging markets looking for financing, 2023 is likely to be considerably better. However, the 2023 outlook will largely depend on what happens with interest rates and inflation in the United States. Investors expect the Fed to begin reducing rates later this year, sensing that inflation is coming down quickly.16 This would ease pressure on emerging market currencies and allow their central banks to also take a more dovish approach. Financial markets appear comfortable with this narrative, funneling money back into emerging market bonds. In just the first two weeks of this year, emerging market countries sold US$39 billion of international bonds, considerably more than the record US$26 billion raised over the same period in 2018.17 However, the Fed’s own messaging has been more hawkish than market expectations, raising the risk that financial pressures could rise again in emerging markets.

China’s abandonment of zero-tolerance COVID-19 protocols, meanwhile, could have implications for sovereign risk. The reopening of China is expected to raise commodity prices. The International Energy Agency’s 2023 forecast shows demand for oil rising faster than supply, which should lift crude oil prices, benefitting OPEC countries.18 After falling in the middle of last year, the prices of other commodities are rising again, which should support government revenue in countries such as Chile, Peru, and South Africa. However, another commodity price cycle will likely challenge government finances in net-importing countries, particularly those in eastern Europe and Asia. It could also force central banks to raise interest rates as inflation rears its ugly head again, applying additional pressure on governments with the need to borrow.

Darkening external environment

After the pandemic hit and the world shifted its demand away from shuttered services and toward spending on goods, emerging market exports soared. As the world shifts back toward services and global economic growth stalls, exports are coming back to earth. Southeast Asian countries have seen some of the strongest deceleration in exports. Malaysia, Singapore, Vietnam, Indonesia, and Thailand, all saw year-over-year export growth slip more than 10 percentage points between Q3 and Q4 of 2022. Plus, Singapore, Indonesia, and Thailand all posted outright year-ago declines in Q4. Weakness in the external environment was not limited to ASEAN countries. India, South Africa, Poland, and Chile all saw year-ago declines in exports in Q4 as well. Although Brazil’s export growth looks like it accelerated strongly in Q4, it was mostly due to base effects. Indeed, December’s exports were the lowest in 11 months.19

Commodity prices had surged in the beginning of 2022 as the war in Ukraine raised concerns over access to the food, metals, and energy that are produced in the region. However, as the world adjusted to the war, commodity prices reversed some of their earlier gains. The decline in commodity prices in the second half of last year contributed to weaker exports, especially for OPEC countries. Exports from Saudi Arabia had already fallen more than 18% between June and October, though the value of exports in October was still far higher than any monthly recording prior to 2022.20 Although China’s reopening could raise the price of oil, it is unlikely that crude will reach the heights seen in the middle of last year. However, such an assessment also depends on how much oil Russia is able to produce amid ongoing sanctions.

China’s reopening should have a larger effect on emerging market exports than just higher commodity prices. Pent-up demand in China should boost demand for exports, particularly in the second half of this year. The sharp rebound in demand should certainly help countries in Asia as China is the largest export market for Malaysia, Singapore, Indonesia, and the Philippines. However, plenty of countries farther afield, such as Brazil, Saudi Arabia, and South Africa, call China their largest export market too.21

Service exports should also rebound as China reopens. With borders virtually closed in China, tourism in Asian countries had taken a huge hit. Before the pandemic, Chinese residents accounted for more than 20% of all tourists in Vietnam, Thailand, and the Philippines, and more than 10% of all tourists in Malaysia and Singapore.22 In 2022, Chinese tourists didn’t account for more than 4% of all tourists in any of those countries, suggesting that the upswing from Chinese tourism could be substantial this year. For an economy like Thailand that relies heavily on tourism, the return of Chinese visitors would dramatically improve its economic output, which remains below its pre-pandemic peak.

The first half of 2023 will continue to present challenges for emerging markets. The risk of recession in the United States and Europe has already contributed to a weaker external environment, while China continues to struggle with the immediate aftermath of loosening COVID-19 restrictions. However, the second half of the year should be brighter. Developed economy central banks may begin to ease or at least no longer tighten monetary policy, providing relief to emerging market currencies and monetary policymakers. Meanwhile, domestic inflation is expected to come down further, which should alleviate some of the cost constraints consumers have faced. The reopening of China, however, could be a double-edged sword. Although it should foster greater demand for emerging market exports, it risks raising commodity prices, thereby exacerbating inflationary pressure just as it was beginning to ease in much of the world.

GlobalData: Auctions Crucial for Brazil Renewable Power Expansion


Renewable power market has developed rapidly in Brazil in recent years, thanks to its remarkable progress in wind, biopower, and solar power sectors. The development of renewables has primarily been due to the introduction of the government’s auctioning system against the backdrop of increase in total electricity demand in the country, said GlobalData.

GlobalData: Auctions crucial for Brazil renewable power expansion

As of 2022, wind power capacity has increased to 23.71 GW, biopower capacity to 16.91 GW, and solar photovoltaic (PV) capacity to 23.24 GW, reflecting the success of Brazil’s renewable power market.

GlobalData’s latest report, ‘Brazil Power Market Size, Trends, Regulations, Competitive Landscape, and Forecast, 2023 – 2035’, observes that during 2003 – 2004, the power sector underwent major reforms to step up regulation in the industry through transparency and stability of rules.

Attaurrahman Ojindaram Saibasan, Power Analyst at GlobalData, commented: “Easy access and a fair return on investment for power producers were considered key objectives. A decree was passed during this time allowing the government to establish an auction mechanism and use it as the main method of developing renewable power capacity. Auctions were introduced to bridge the supply demand gap by attracting new generation capacity, ensuring supply adequacy, and procuring electricity based on load forecasts. Auctions are either technology-specific or are technology-neutral.”

Between 2015 and 2022, a total of 14.1 GW capacity has been awarded through the auction mechanism. Wind power and solar PV have been the two favored technologies accounting for 40.8% and 33.8% respectively of the total awarded capacity between 2015 – 2022.

Saibasan added: “There has been a decline in awarded capacity from 2018 to 2022 due to reduced interest from industry participants because of rising costs and reduction in ceiling prices set by the government, making it an unattractive investment option.”

Brazil is focusing on the development of the renewable power sector to reduce its dependence on hydro plants for power generation. Within renewables, solar PV and wind power have been the core focus areas.

The government is expected to launch the first offshore wind auction in 2023 and the winning projects are slated to be operational in 2027. Between 2023 – 2035, 76.9 GW of solar PV capacity is expected to be added, whereas onshore wind capacity additions are expected to be approximately 17.8 GW.

Saibasan concluded: “Auctions are crucial for Brazil to achieve its renewable generation target and emission reduction target. Brazil has set a target to achieve 45% renewable power in the energy mix and 23% renewable power in electricity generation by 2030.

“The government should look for ways to maneuver around the current challenges and make the auction scheme more attractive. The government may look at floating price schemes or contracts for difference (CfD) schemes to protect renewable power developers from rising costs as well as protect itself from overcompensating once the global energy crisis subdues.”


Published by , Editorial Assistant
Energy Global

10 Investing Concepts Beginners Need to Learn

Key Attitudes and strategic frameworks for Intelligent and successful investors…

Getting started as an investor can be a daunting task. According to the 2022 Investopedia Financial Literacy Survey, 57% of U.S. adults are invested, but just one in three say they have advanced investing knowledge. Getting started can be especially daunting if you are a methodical person who is cautious about commencing such an important undertaking before you have acquired sufficient knowledge, expertise, and confidence.

Meanwhile, creating a short list of everything that a beginning investor should know inevitably runs the risk of excluding many vital points. Indeed, successful investors are bound to differ widely on what they would include in their top ten lists if they were pressed to replicate this exercise.

That said, we offer what we hope is a useful checklist to help you get started as a successful investor. We have chosen to emphasize key personal attitudes and overarching strategic frameworks that, in our opinion, will help you to become an intelligent investor.

KEY TAKEAWAYS
  • Have a plan, prioritize saving, and know the power of compounding.
  • Understand risk, diversification, and asset allocation.
  • Minimize investment costs.
  • Learn classic strategies, be disciplined, and think like an owner or lender.
  • Never invest in something you do not fully understand.


The first step toward becoming a successful investor should be starting with a financial plan—one that includes goals and milestones. These goals and milestones would include setting targets for having specific amounts saved by specific dates.

The goals in question might include, for example, having enough savings to facilitate buying a home, funding your children’s education, building an emergency fund, having enough to fund an entrepreneurial venture, or having enough to fund a comfortable retirement.

Moreover, while most people think in terms of saving for retirement, an even more desirable goal would be to achieve financial independence at as early an age as possible. A movement devoted to this goal is Financial Independence, Retire Early (FIRE).

While it is possible to create a solid financial plan on your own, if you are new to the process, you might consider enlisting professional help from someone such as a financial advisor or financial planner, preferably one who is a Certified Financial Planner (CFP®). Finally, do not delay. Seek to have a plan in place as early as possible in your lifetime, and keep it a living document, updated regularly and in light of changed circumstances and goals.


2. Make Saving a Priority

Before you can become an investor, you must have money to invest. For most people, that will require setting aside a portion of each paycheck for savings. If your employer offers a savings plan such as a 401(k), this can be an attractive way to make saving automatic, especially if your employer will match all or part of your own contributions.

In setting up your financial plan, you also might consider other alternatives for making saving automatic, in addition to utilizing employer-sponsored plans. Building wealth typically has aggressive saving at its core, followed by astute investing aimed at making those savings grow.

Also, a key to saving aggressively is living frugally and spending with caution. In this vein, a wise adjunct to your financial plan would be creating a budget, tracking your spending closely, and regularly reviewing whether your outlays are making sense and delivering sufficient value. Various budgeting apps and budgeting software packages are available, or you can choose to create your own spreadsheets.


3. Understand the Power of Compounding

Saving and investing on a regular, systematic basis and starting this discipline as early as possible in life will allow you to take full advantage of the power of compounding to increase your wealth. The current protracted period of historically low interest rates has diminished the power of compounding to some extent, but it also has made starting early to build savings and wealth more imperative, since it will take interest-bearing and dividend-paying investments longer to double in value than before, all else equal.


4. Understand Risk

Investment risk has many aspects, such as default risk on a bond (the risk that the issuer may not meet its obligations to pay interest or repay principal) and volatility in stocks (which can produce sharp, sudden increases or decreases in value). Additionally, there is, in general, a tradeoff between risk and return, or between risk and reward. That is, the route to achieving higher returns on your investments often involves assuming more risk, including the risk of losing all or part of your investment.

As a critical part of your planning process, you should determine your own risk tolerance. How much you can be prepared to lose should a prospective investment decline in value, and how much ongoing price volatility in your investments you can accept without inducing undue worry, will be important considerations in determining what sorts of investments are most appropriate for you.

Risk

At its most basic level, investment risk includes the possibility of a complete loss. But there are many other aspects to risk and its measurement.

5. Understand Diversification and Asset Allocation

Diversification and asset allocation are two closely related concepts that play important roles both in managing investment risk and in optimizing investment returns. Broadly speaking, diversification involves spreading your investment portfolio among a variety of investments, in hopes that subpar returns or losses in some may be offset by above average returns or gains in others. Likewise, asset allocation has similar goals, but with the focus being on distributing your portfolio across major categories of investments, such as stocks, bonds, and cash.

Once again, your ongoing financial planning process should revisit your decisions on diversification and asset allocation regularly

6. Keep Costs Low


You cannot control the future returns on your investments, but you can control the costs. Moreover, costs (e.g., transaction costsinvestment management feesaccount fees, etc.) can be a significant drag on investment performance. Similarly, taking mutual funds as just one example, high cost is no guarantee of better performance.

The Importance of Costs

Investment costs and fees are often a key determinant of investment results.


7. Understand Classic Investment Strategies

Among the investment strategies that the beginning investor should understand fully are active versus passive investingvalue versus growth investing, and income-oriented versus gains-oriented investing.

While savvy investment managers can beat the market, very few do it consistently over the long term. This leads some investment pundits to recommend low-cost passive investing strategies, mainly those utilizing index funds, that seek to track the market.

In the realm of equity investing, value investors prefer stocks that appear to be relatively inexpensive compared to the market on measures such as price-earnings ratios (P/E), expecting that these stocks have upside potential as well as limited downside risk. Growth investors, by contrast, see greater opportunity for gain among stocks that are recording rapid increases in revenues and earnings, even if they are relatively expensive.

Income-oriented investors seek a steady stream of dividends and interest because they need the ongoing spendable cash, they see this as a strategy that limits investment risk, or both. Among the variations of income-oriented investing is focusing on stocks that offer dividend growth.

Gains-oriented investors are largely unconcerned about income streams from their investments and instead look for the investments that seem likely to deliver the most price appreciation in the long term.


8. Be Disciplined

If you are investing for the long term, according to a well-thought and well-constructed financial plan, stay disciplined. Try not to get excited or rattled by temporary market fluctuations and panic-inducing media coverage of the markets that might border on the sensationalistic. Also, always take the pronouncements of market pundits with a grain of salt unless they have lengthy, independently verified track records of predictive accuracy. Few do.


9. Think Like an Owner or Lender

Stocks are shares of ownership in a business enterprise. Bonds represent loans extended by the investor to the issuer. If you intend to be an intelligent long-term investor rather than a short-term speculator, think like a prospective business owner before you buy a stock, or like a prospective lender before you buy a bond. Do you want to be a part owner of that business, or a creditor of that issuer?


10. If You Don’t Understand It, Don’t Invest in It

Given the proliferation of complex and novel investment products, as well as of companies with complex and novel business models, beginning investors today are faced with a vast array of investment choice that they may not fully understand. A simple and wise rule of thumb is never to make an investment that you do not fully understand, particularly when it comes to its risks. A corollary is to be very careful about avoiding investing fads, many of which may not stand the test of time.

Avoid investments you don’t fully understand. They may present large hidden dangers.
What Do I Need to Know Before Investing?

Before investing, it is critical to know what your goals and objectives are. Whether it be to fund retirement, purchase a home, or undertake a new business venture, knowing what you’re working towards will help you choose an investment to help you meet your goals. It is also important to know the basics about investing—such as risks, fees and costs, and investment strategies—and understand the investment you’re prospecting.

What Are the 4 Main Types of Investments?

While there are many investment categories, the four basic types are stocks, bonds, mutual funds, and exchange-traded funds (ETFs). Stocks are shares of ownership in a company. Bonds are essentially loans made by the investor to the issuer, who promises to pay the principal at maturity and interest over the bond’s term. Mutual funds are funds in which multiple investors pool their money together to purchase stocks or other securities, and ETFs are like mutual funds but are traded on national stock exchanges.

Is $100 Enough to Start Investing?

Many prospective investors believe they must have a lot of money to begin investing. However, many investments have low thresholds, giving new investors opportunities to start their journey. You can begin investing with $100 or less. For instance, you could purchase shares or fractional shares of stock, use a robo-advisor to invest based on your goals, contribute to a retirement plan, or invest in a mutual fund. The options are plenty.


The Bottom Line

As a new investor, choosing the right investments or investment strategy can be intimidating, and the advice on how to proceed is as diverse as the selection of investments from which to choose. Despite the innumerous recommendations, building your knowledge and having a solid understanding of investing and your goals is key to making informed decisions that will likely yield favorable results.

Investopedia

INTERNATIONAL ENERGY OUTLOOK-EIA

GLOBAL NATURAL GAS PRODUCTION CONTINUES TO INCREASE AT A STEADY RATE ACROSS THE PROJECTION PERIOD, FOLLOWING PRODUCTION GAINS IN THE LAST DECADE

In the Reference case, global natural gas production steadily increases, growing by approximately 30% between 2020 and 2050. Before that, natural gas production grew by 25% between 2010 and 2020, with the aid of new recovery techniques and expanded infrastructure. Projected growth in global natural gas demand and the expansion of processing and transportation infrastructure around the world drives growth in natural gas production to 2050.

In addition, demand from the industrial sector—for both natural gas and NGPLs—supports growth in natural gas production, while growth is more limited in the electric power, transportation, and residential and commercial sectors. Although use of natural gas for electric power generation increased by almost 30% from 2010 to 2020, this growth will likely plateau in 2030. The role of natural gas in the electric power sector has become increasingly complex because of economic and policy trends that favor renewable energy.

Some future growth in natural gas production will likely coincide with crude oil production growth because crude oil production from low permeability, tight rock formations produces associated-dissolved natural gas (also called associated gas) which, in some areas, is captured and processed.

Figure 38.

Figure 38
THE UNITED STATES, RUSSIA, AND THE MIDDLE EAST REMAIN THE LARGEST NATURAL GAS PRODUCERS AND EXPORTERS THROUGH 2050

Figure 39.

Figure 39


The United States, Russia, and the Middle East are currently the largest producers of natural gas. In the Reference case, all three will continue to expand production throughout the projection period, and the United States will remain the largest producer worldwide, producing almost 43 trillion cubic feet (Tcf) in 2050.

The United States, Russia, and the Middle East all have large proven reserves of both natural gas and oil, along with the accompanying processing and transportation infrastructure to support steady production levels. In addition to meeting domestic demand, growing production in these regions serves growing demand for natural gas in the global market. The three largest producing regions all export more natural gas than they import; their exports go to key regions in Europe and Asia, where demand is greater than domestic supply. We project that the demand for natural gas from these regions grows further. The United States’ and Russia’s natural gas production grows by about 10 Tcf between 2020 and 2050 in the Reference case. Middle East natural gas production grows by about 5 Tcf over the same period.

Figure 40.

Figure 40

In the Reference case, Russia, the United States, and the Middle East will all grow as net exporters throughout the projection period to provide natural gas to European and Asian markets. Russia, in particular, shows the most growth in net exports, more than doubling over the projection period to remain the largest net exporter of natural gas through 2050 at more than 14 Tcf. Because it is near Europe, China, and the rest of non-OECD Asia, Russia’s net natural gas exports will grow through established pipeline infrastructure, potential future pipeline additions, and liquefied natural gas exports. The United States also shows rapid growth in net exports over the next 10 years, as it continues to expand its LNG infrastructure and produce natural gas at high volumes. LNG terminals and transportation vessels facilitate the overseas transport of natural gas between regions that are not connected by pipeline, creating an outlet for natural gas produced in the United States and the Middle East to reach overseas markets where it is in the highest demand.

KEY DESTINATIONS FOR NATURAL GAS EXPORTS ARE EUROPE AND ASIA, AND NON-OECD ASIA GROWS THE MOST

Figure 41.

Figure 39

In 2020, OECD Europe was the largest importer of natural gas, followed by Japan, South Korea, and non-OECD Asia. All of these regions are net importers due to their limited domestic supply of natural gas relative to their growing demand. These regions remain the largest natural gas export destinations through the projection period.

In the Reference case, both non-OECD Asia and OECD Europe increase their use of imported natural gas, and non-OECD Asia grows to become the largest net importer of natural gas by 2050—driven by continued economic growth in China and India. Net imports of natural gas into China, India, and other non-OECD Asian nations more than triple by 2050. Supply of natural gas in these markets arrives both via pipeline and as LNG exports from Russia. The regions also receive LNG exports from regions such as the United States, the Middle East, Australia, and Africa.


EIA

Reshoring Supply Chains: What does it mean for Investors?

Of all the lessons learned during the pandemic — wash your hands thoroughly, avoid crowded elevators, working from home can be productive — perhaps the most consequential lesson for companies is now obvious in hindsight: Relying on single links in the global supply chain was a mistake.

Major components of the supply chain fractured during the COVID-19 crisis, resulting in shortages of everything from medical supplies and equipment to furniture and auto parts. Geopolitical events also entered the fray as U.S.-China tensions and Russia’s invasion of Ukraine underscored the risks of relying too much on one place for critical supplies, including energy, food and computer chips.
“With the rapid spread of globalization over the past few decades, companies moved their manufacturing operations to the cheapest and most efficient countries,” says Julian Abdey, a portfolio manager with The Growth Fund of America®.
“That was great for company profits and consumer prices,” he continues. “But what we found out more recently is that when supply chains get disrupted it can cause real problems. For example, Europe has realized it was too dependent on Russia for natural gas. And I think the same is true for other products like computer chips. The world is too dependent on Asia, and Taiwan in particular, for semiconductors.”
Reshoring replaces offshoring
Fast forward to 2023, and many companies — in some cases spurred by massive government subsidies — are taking big steps to diversify their supply chains, focusing on reliability and robustness over cost and efficiency. That means bringing some manufacturing back home, or “reshoring” and moving some of it to other countries.
The trend has raised questions about whether the world is moving into a period of de-globalization. However, based on trade activity in recent years, the new path looks more like a measured adjustment to global supply chains, partially interrupted by the pandemic and the 2007–2009 financial crisis.

Globalization marches on — at a different pace


The image shows the generally rising path of world trade over the past five decades, expressed as a percent of global gross domestic product (GDP). Trade activity rises sharply from around 25% in 1970 to above 60% in 2007, then slows afterward. For reference purposes, the image also shows major events along the same timeline, including the U.S. decision to abandon the gold standard in 1971, the collapse of the Soviet Union in 1991, the adoption of the North American Free Trade Agreement in 1994, the September 11 terrorist attacks in 2001, the global financial crisis from 2007 to 2009 and the COVID-19 pandemic from 2020 to 2023.

Sources: Capital Group, Organization for Economic Co-operation and Development (OECD), World Bank. World trade is calculated as the sum of exports and imports of goods and services and is represented above as a share of global gross domestic product. Trade data as of 2021.

“When we talk to companies and look at the data, we are not seeing what I would call de-globalization,” says Rob Lovelace, a portfolio manager with New Perspective Fund®. “I think it would be more accurate to call it a rewiring of global supply chains. And I don’t think it’s really all that dramatic when you consider the rapid growth of digital trade, which is harder to track using traditional metrics, as opposed to physical trade.”

In fact, there is ample evidence that many companies are becoming more global as they seek to create redundant supply chains. The poster child for this development is Taiwan Semiconductor Manufacturing Company or TSMC, the world’s largest semiconductor foundry. To expand its global reach, TSMC is building new manufacturing plants in Arizona and Japan. Semiconductors have become such a sensitive issue, given their use in the defense industry, that the U.S. government has placed aggressive restrictions on where and how they can be exported.
Other examples abound in the tech sector and elsewhere. Apple announced in September that it would start producing the iPhone 14 in India, adding to its manufacturing capabilities in China, the Czech Republic and South Korea among others. In the auto sector, Tesla added to its U.S. and China manufacturing hubs last year by opening its first European outpost in Gruenheide, Germany.
In the energy sector, Texas-based ECV Holdings has announced plans to build a power plant for industrial parks near Ho Chi Minh City, Vietnam, supplied primarily by U.S. liquified natural gas. Meanwhile, the list of U.S. companies establishing new manufacturing plants at home has grown dramatically in recent years to include General Motors, Intel and U.S. Steel — fueling hopes of an American industrial renaissance.
The China+1 strategy
Amid this drive to diversify supply chains, a common misconception is that China may be displaced as the world’s largest manufacturing base. Rather, many companies are shifting to a “China+1 strategy” by maintaining operations in China while adding new facilities elsewhere, says Winnie Kwan, a portfolio manager with New World Fund®. Incremental investments in China are likely to focus on serving mainly the domestic market, she notes, while additional investments in other locations cater to the rest of the world.
“A key question is whether the China+1 strategy will be scalable or not,” Kwan says. “Can you add a new plant in India or Mexico, for example, and scale up production as needed? Is the labor and power supply sufficient? Is logistics infrastructure in place? Can management handle the added complexity? Those are the questions I am focusing on as we research these developments and look for investment opportunities. Not every company is going to get it right.”
Indeed, the flow of incremental investments is an important metric for investors to track. According to a 2021 survey of foreign companies doing business in China conducted by AmCham Shanghai, the top destinations for redirected investments were Southeast Asia, Mexico, India and the United States. However, only 63 of the 338 companies surveyed said they had such plans, which suggests the process of reshoring may be slower and more deliberate than some market participants are expecting.
“It could take a decade for companies to fully transition,” she adds. “But the process has certainly started, and I think it will be one of the more important investment themes of the 2020s.”

Southeast Asia is well positioned for the rewiring of global supply chains


The image shows the top destinations companies are choosing when redirecting investments from China. According to a survey by AmCham Shanghai, 50.8% of redirected investments from China are going to Southeast Asia, 34.9% are going to Mexico, 30.2% are going to India and 22.2% are going to the United States.

Source: AmCham Shanghai 2021 China Business Report, published September 22, 2021. Based on a survey of 338 foreign companies doing business in China. Of those companies, 63 said they were redirecting investments from China to other locations, including Southeast Asia, Mexico, India and the United States, among others.

Who benefits from reshoring?

With such a large undertaking, the investment implications are widespread across a number of sectors and geographies. Here are four areas expected to benefit from reshoring in the years ahead.
1. India Thanks to its proximity to China, a well-educated labor force, and a fast-growing, business-friendly economy, India may be the best-positioned country to capitalize on supply chain diversification. India’s government has taken bold steps to encourage the expansion of manufacturing operations, particularly in the smartphone space, where Apple works with contractors such as Foxconn to build the latest iPhones. The manufacturing sector is expected to accelerate over the next decade, driving growth in the Indian economy and boosting other industries such as banking, energy and telecommunications.
“India is arguably better positioned today than China was 20 years ago,” says Capital Group equity analyst Johnny Chan.
2. Mexico Similar to India, Mexico’s proximity to one of the world’s largest economies makes it an attractive base for expanded manufacturing and logistics operations. Many U.S. companies flocked there in the 1990s after the adoption of the North American Free Trade Agreement (NAFTA). That process has only accelerated under a revamped trade deal, the U.S./Mexico/Canada Agreement (USMCA), ratified in 2020.
Mexico’s annual exports to the U.S. have increased sharply in recent years. Although much of that is due to the influence of American companies, China is also ramping up in Mexico. For example, Hisense Group, one of China’s largest appliance makers, is currently building a $260 million industrial park in Monterrey, aiming to produce refrigerators, washing machines and air conditioners for the U.S. market. In the auto sector, BMW and Nissan have also recently expanded their capabilities south of the border.
3. Automation providers One of the biggest hurdles to diversifying the world’s manufacturing capabilities is a chronic labor shortage, especially in developed economies. Automation powered by artificial intelligence (AI) is likely to provide an answer to this problem, says Mark Casey, a portfolio manager with The Growth Fund of America®. Many Asian countries are setting the trend with high rates of industrial automation, with the U.S. and Europe expected to follow. Both regions have room to grow, proving a bright outlook for top companies in the global robotics industry, including Japan’s Keyence, France’s Schneider Electric and Switzerland’s ABB Ltd. Amazon is also developing its own impressive AI-driven technology, Casey notes.
“Amazon has a new robotic picking-and-packing device called Sparrow that can grab more than 60 million different products and pack them into shipping boxes — completing each pick in a matter of seconds,” Casey says. “Just seven years ago Amazon’s experimental robots could handle only a small number of items, and each pick would take a couple minutes. I think this sort of technology is coming along sooner than we think, and I don’t see it accounted for in the stock prices of any major American or European company.”

The bar chart shows the annual installations of industrial robots in Asia/Australia (navy blue), Europe (light blue) and the Americas (green) in 2020 and 2021, and projected installations for 2022, 2023, 2024 and 2025. In Asia/Australia, the annual installation of industrial robots was 277,000 in 2020, and 381,000 in 2021, and is expected to reach 416,000 by 2022, 448,000 by 2023, 484,000 by 2024, and 525,000 units by 2025. In Europe, the annual installation of industrial robots was 68,000 in 2020, and 84,000 in 2021, and is expected to increase to 87,000 in 2022, and 90,000 in 2023, before dropping slightly to 88,000 in 2024, and then increasing back to 90,000 units by 2025. In the Americas, the annual installation of industrial robots was 39,000 units in 2020, and 51,000 in 2021, and is expected to increase to 56,000 in 2022, 66,000 in 2023, and 70,000 in 2024, before dropping to 65,000 units by 2025.

Sources: Capital Group, International Federation of Robotics. As of 2022.

4. Multinationals Although it may seem counterintuitive, the same multinational companies that benefited most from the rapid pace of globalization in the past may be best equipped to navigate the brave new world of re-globalization, says Jody Jonsson, also a portfolio manager with New Perspective Fund. The world’s largest and most dominant companies rose to that position for a reason — they often have the experience and resources to adapt to changing trade patterns better than smaller companies operating in single markets.

“In my view, well-managed multinational companies will remain global in their production facilities and customer bases, but they will increasingly build more local redundancy into their operations,” Jonsson says. “I call it ‘multi-localization.’ That includes bringing some parts of the supply chain back to the U.S., continuing to outsource other parts and establishing new production facilities in key areas throughout the world.
“If there is one lesson, we’ve learned from the COVID crisis, it’s that companies must have diverse supply chains,” she adds. “We aren’t there yet, but the process is well underway.”

Julian Abdey is an equity portfolio manager with 27 years of investment industry experience (as of 12/31/2022). He holds an MBA from Stanford and an undergraduate degree in economics from Cambridge University.

Rob Lovelace is vice chair and president of Capital Group as well as an equity portfolio manager with 37 years of investment experience (as of 12/31/2022). He holds a bachelor’s degree in mineral economics from Princeton University. He also holds the Chartered Financial Analyst® designation. 

Winnie Kwan is an equity portfolio manager with 26 years of investment experience (as of 12/31/2022). She holds master’s and bachelor’s degrees in economics from Cambridge.


Learn more about